FIGURE 2.
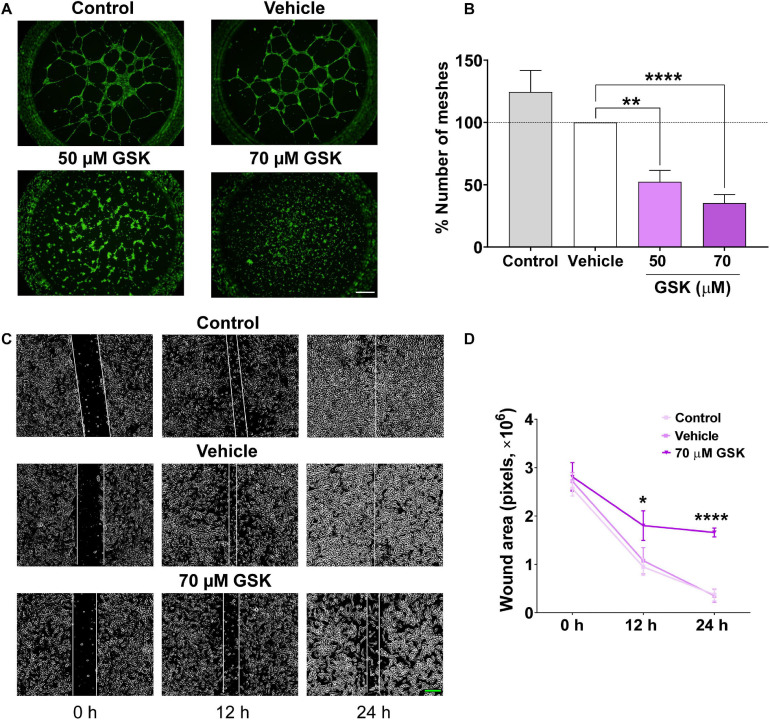
GSK-7975A decreases HUVEC tube formation and migration. (A) Fluorescence images (×4 objective; scale bar = 500 μm) are from HUVECs (control, vehicle, 50 and 70 μM of GSK) incubated with Calcein-AM and seeded on Matrigel. (B) Bar graph shows normalized means of the percentage of meshes to the number in HUVECs treated with vehicle (gray). Bars are for untreated HUVECs, for HUVECs treated with vehicle (white), and with 50 or 70 μM of GSK (n = 6). (C) Phase-contrast imaging (×10 objective; green scale bar = 200 μm) of the HUVEC wound healing assay. HUVEC was cultured in the endothelial cell culture medium (EGM-2) enriched with growth factors. Images are from control cells and for those treated with vehicle and 70 μM of GSK, taken at 0, 12, and 24 h. (D) Graph shows summary data of the evolution of the wound area (n = 6 per group). Values are presented as the means ± S.E.M. (*), (**), and (****) indicate significance with p < 0.05, p < 0.01, and p < 0.0001, respectively.

