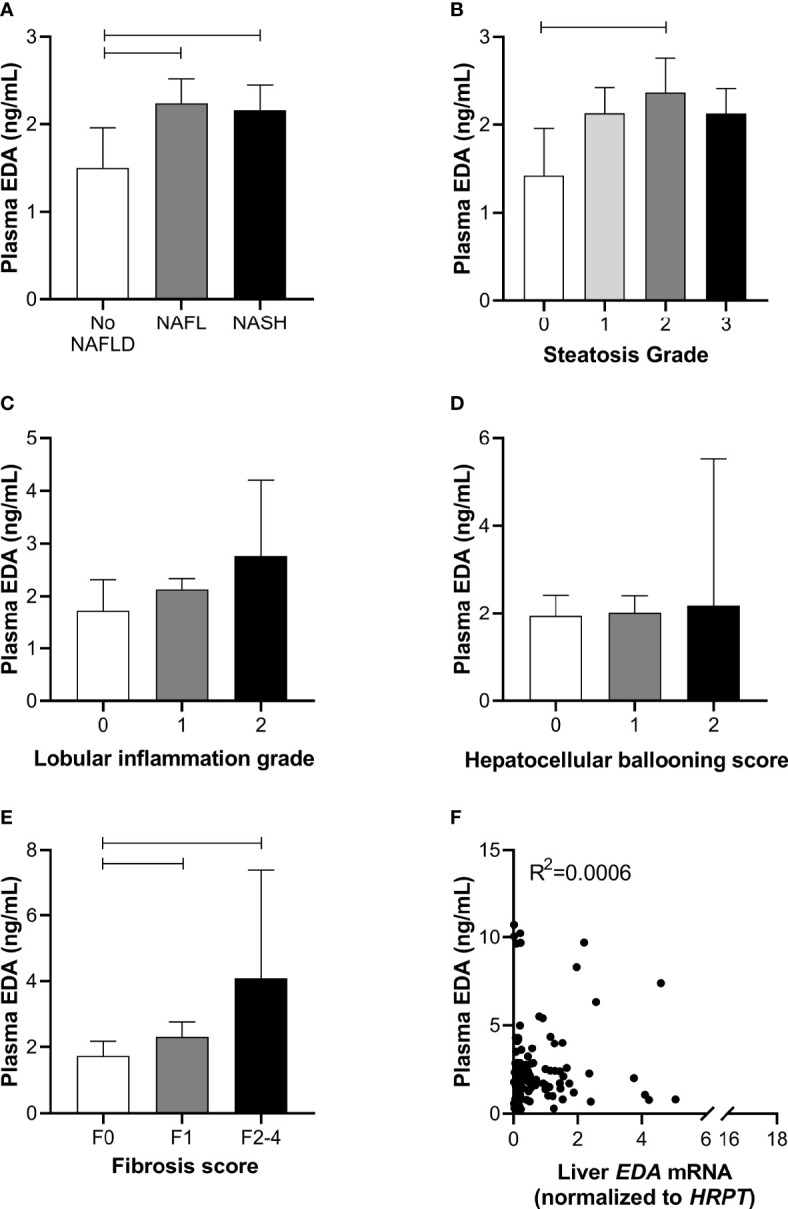
Figure 2.

Plasma EDA and NAFLD progression. Plasma EDA levels by (A) patient group, (B) steatosis grade, (C) lobular inflammation score, (D) hepatocellular ballooning score and (E) fibrosis score. Shown are median and 95% confidence interval. Data were analyzed by Kruskal-Wallis test and Dunn’s multiple comparisons test. Adjoining lines indicate P<0.05. (F) Relationship between liver EDA mRNA and plasma EDA.
