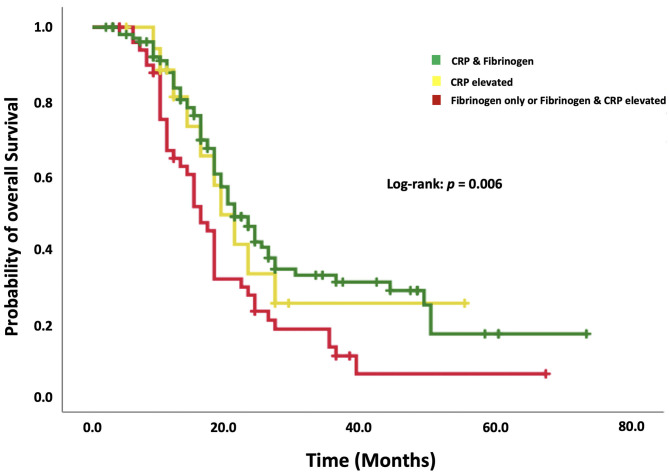
Figure 3.
Kaplan–Meier analysis of the survival probability stratified by “normal CRP and fibrinogen,” “increased CRP only,” and “increased fibrinogen with or without increased CRP.” Censored patients (alive at last follow-up) are indicated on the curves. The time axis is right-censored at 80 months. p = 0.006 (log-rank test).

