Figure 5.
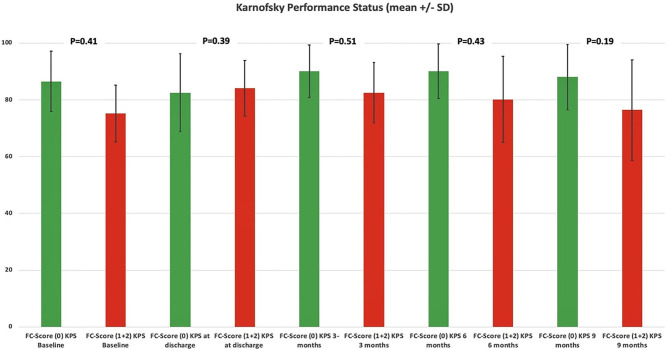
Functionality according to the Karnofsky Performance Status among dichotomized FC scores. Means (column) and 95% confidence intervals (lines) for the Karnofsky Performance Status, illustrating the degree of functionality in the period from admission to follow-up examination at 9 months stratified by the parameters FC score 0 (green column) and FC score ≥1 (red column). p-values of the Student's t-test are shown.

