Fig. 4.
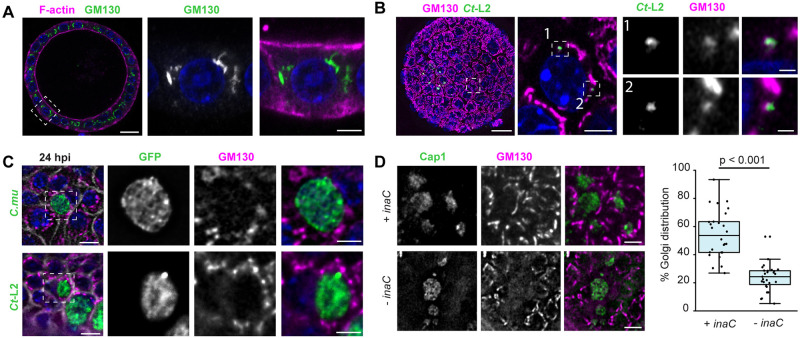
Chlamydia infections causes reorganization of the Golgi apparatus in endometrial epithelia. (A,B) The organization of the Golgi apparatus in EMOs. (A) EMO stained for F-actin and GM130, as a Golgi marker, and imaged by confocal microscopy. Box denotes region shown in enlarged panels. Scale bars: 20 µm (left), 5 µm (right). (B) EMO infected with GFP-expressing C. trachomatis L2 (Ct-L2) for 20 h and stained for GM130, as a Golgi marker, imaged by confocal microscopy. Left, maximum intensity projection. Dashed box denotes region of interest showing relative localization of GM130 with respect to small, early inclusions in a single confocal section (middle). Numbered boxes indicate regions shown in enlarged panels on the right. Scale bars: left, 20 µm; middle, 5 µm; right, 1 µm. (C) The Golgi apparatus relocalizes to the periphery of C. muridarum (C.mu) and C. trachomatis inclusions at mid infection cycle. 3D deconvolution microscopy of tdTomato-expressing EMOs infected with GFP-expressing C. muridarum (top) or C. trachomatis L2 (bottom) for 24 h and stained for GM130. Scale bars: 10 µm. Enlarged region of interest (dashed box) shows relative localization of GM130 with respect to the inclusion. Scale bars: 5 µm. (D) InaC is required for Golgi repositioning in infected EMO cells. EMOs were infected with an inaC mutant M407 complemented with a plasmid expressing InaC (+ inaC) or transformed with an empty vector (− inaC) for 24 h. Samples were stained for GM130 as a Golgi marker and Cap1 for the inclusion. Scale bars: 10 µm. The percentage of Golgi distribution around the inclusion perimeter was quantified (n=26–27 inclusions). Boxplots show the median and interquartile range (IQR), with the bottom whiskers indicating the minimum value and the top whiskers indicating Q3+1.5×IQR. Statistical significance was measured using an unpaired, two-tailed Student's t-test. For all images, DNA was stained using 2 µg/ml Hoechst (blue).

