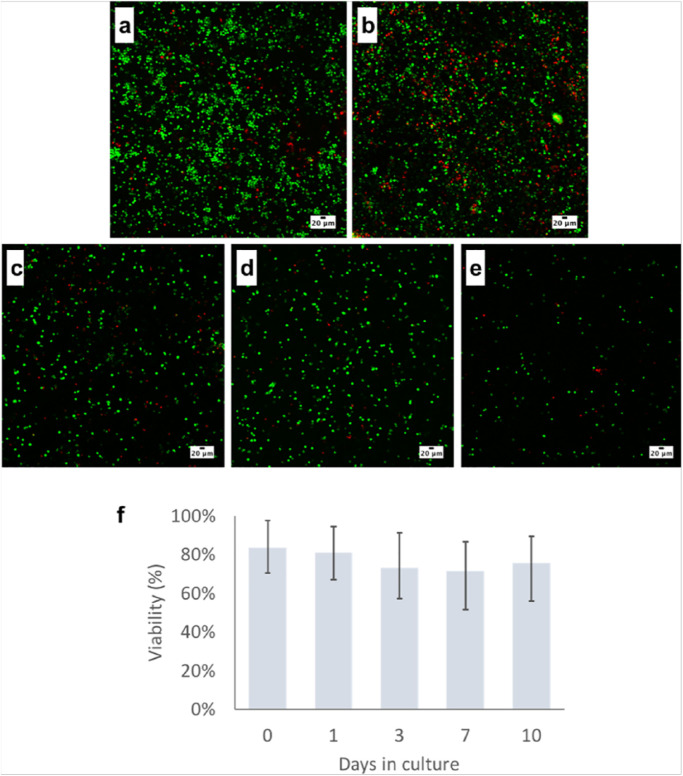
Figure 4.
Live cell confocal fluorescence images (a-e) (z-projections) showing the live (green) and dead (red) cell populations within a single clot from the study. Images a and b were captured at day 1 in 2 locations in the clot and demonstrate the large number of viable cells spread through lateral cross-section of a clot. Images c, d, and e represent clots at days 3, 7, and 10, respectively, where good cell viability was maintained. Cell density appears to decrease gradually as the clots gradually break up in culture. The viability plot (f) presents the average cell viability across all samples grouped by timepoint with error bars representing range of viability values.

