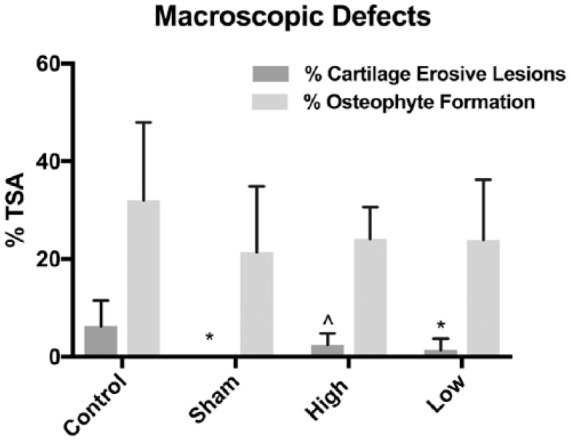
Figure 2.

Differences in cartilage erosive lesions and osteophyte formation between groups. Each data set is presented normalized (percentage) relative to the total surface area (TSA) of the distal femoral condyle. *Signifies P < 0.01 versus control group, and ^indicates P = 0.0595 (trend).
