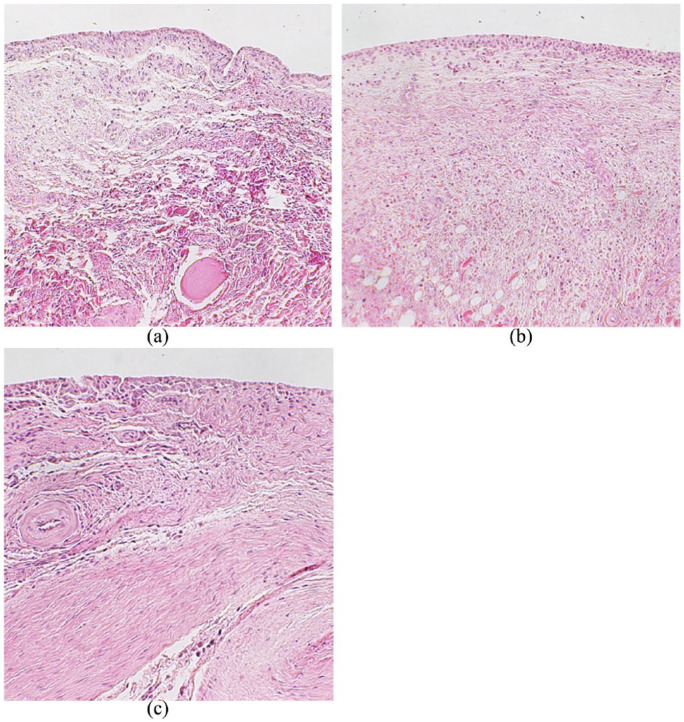
Figure 5.
Synovium histopathological samples at 10× magnification. The control group (A) had enlargement of the synovial lining cell layer and increased density of resident cells. The low-dose group (B) demonstrated mild reactive synovial hyperplasia. The high-dose group exhibited the lowest grade synovitis, with a single cell lining layer to the right (C).

