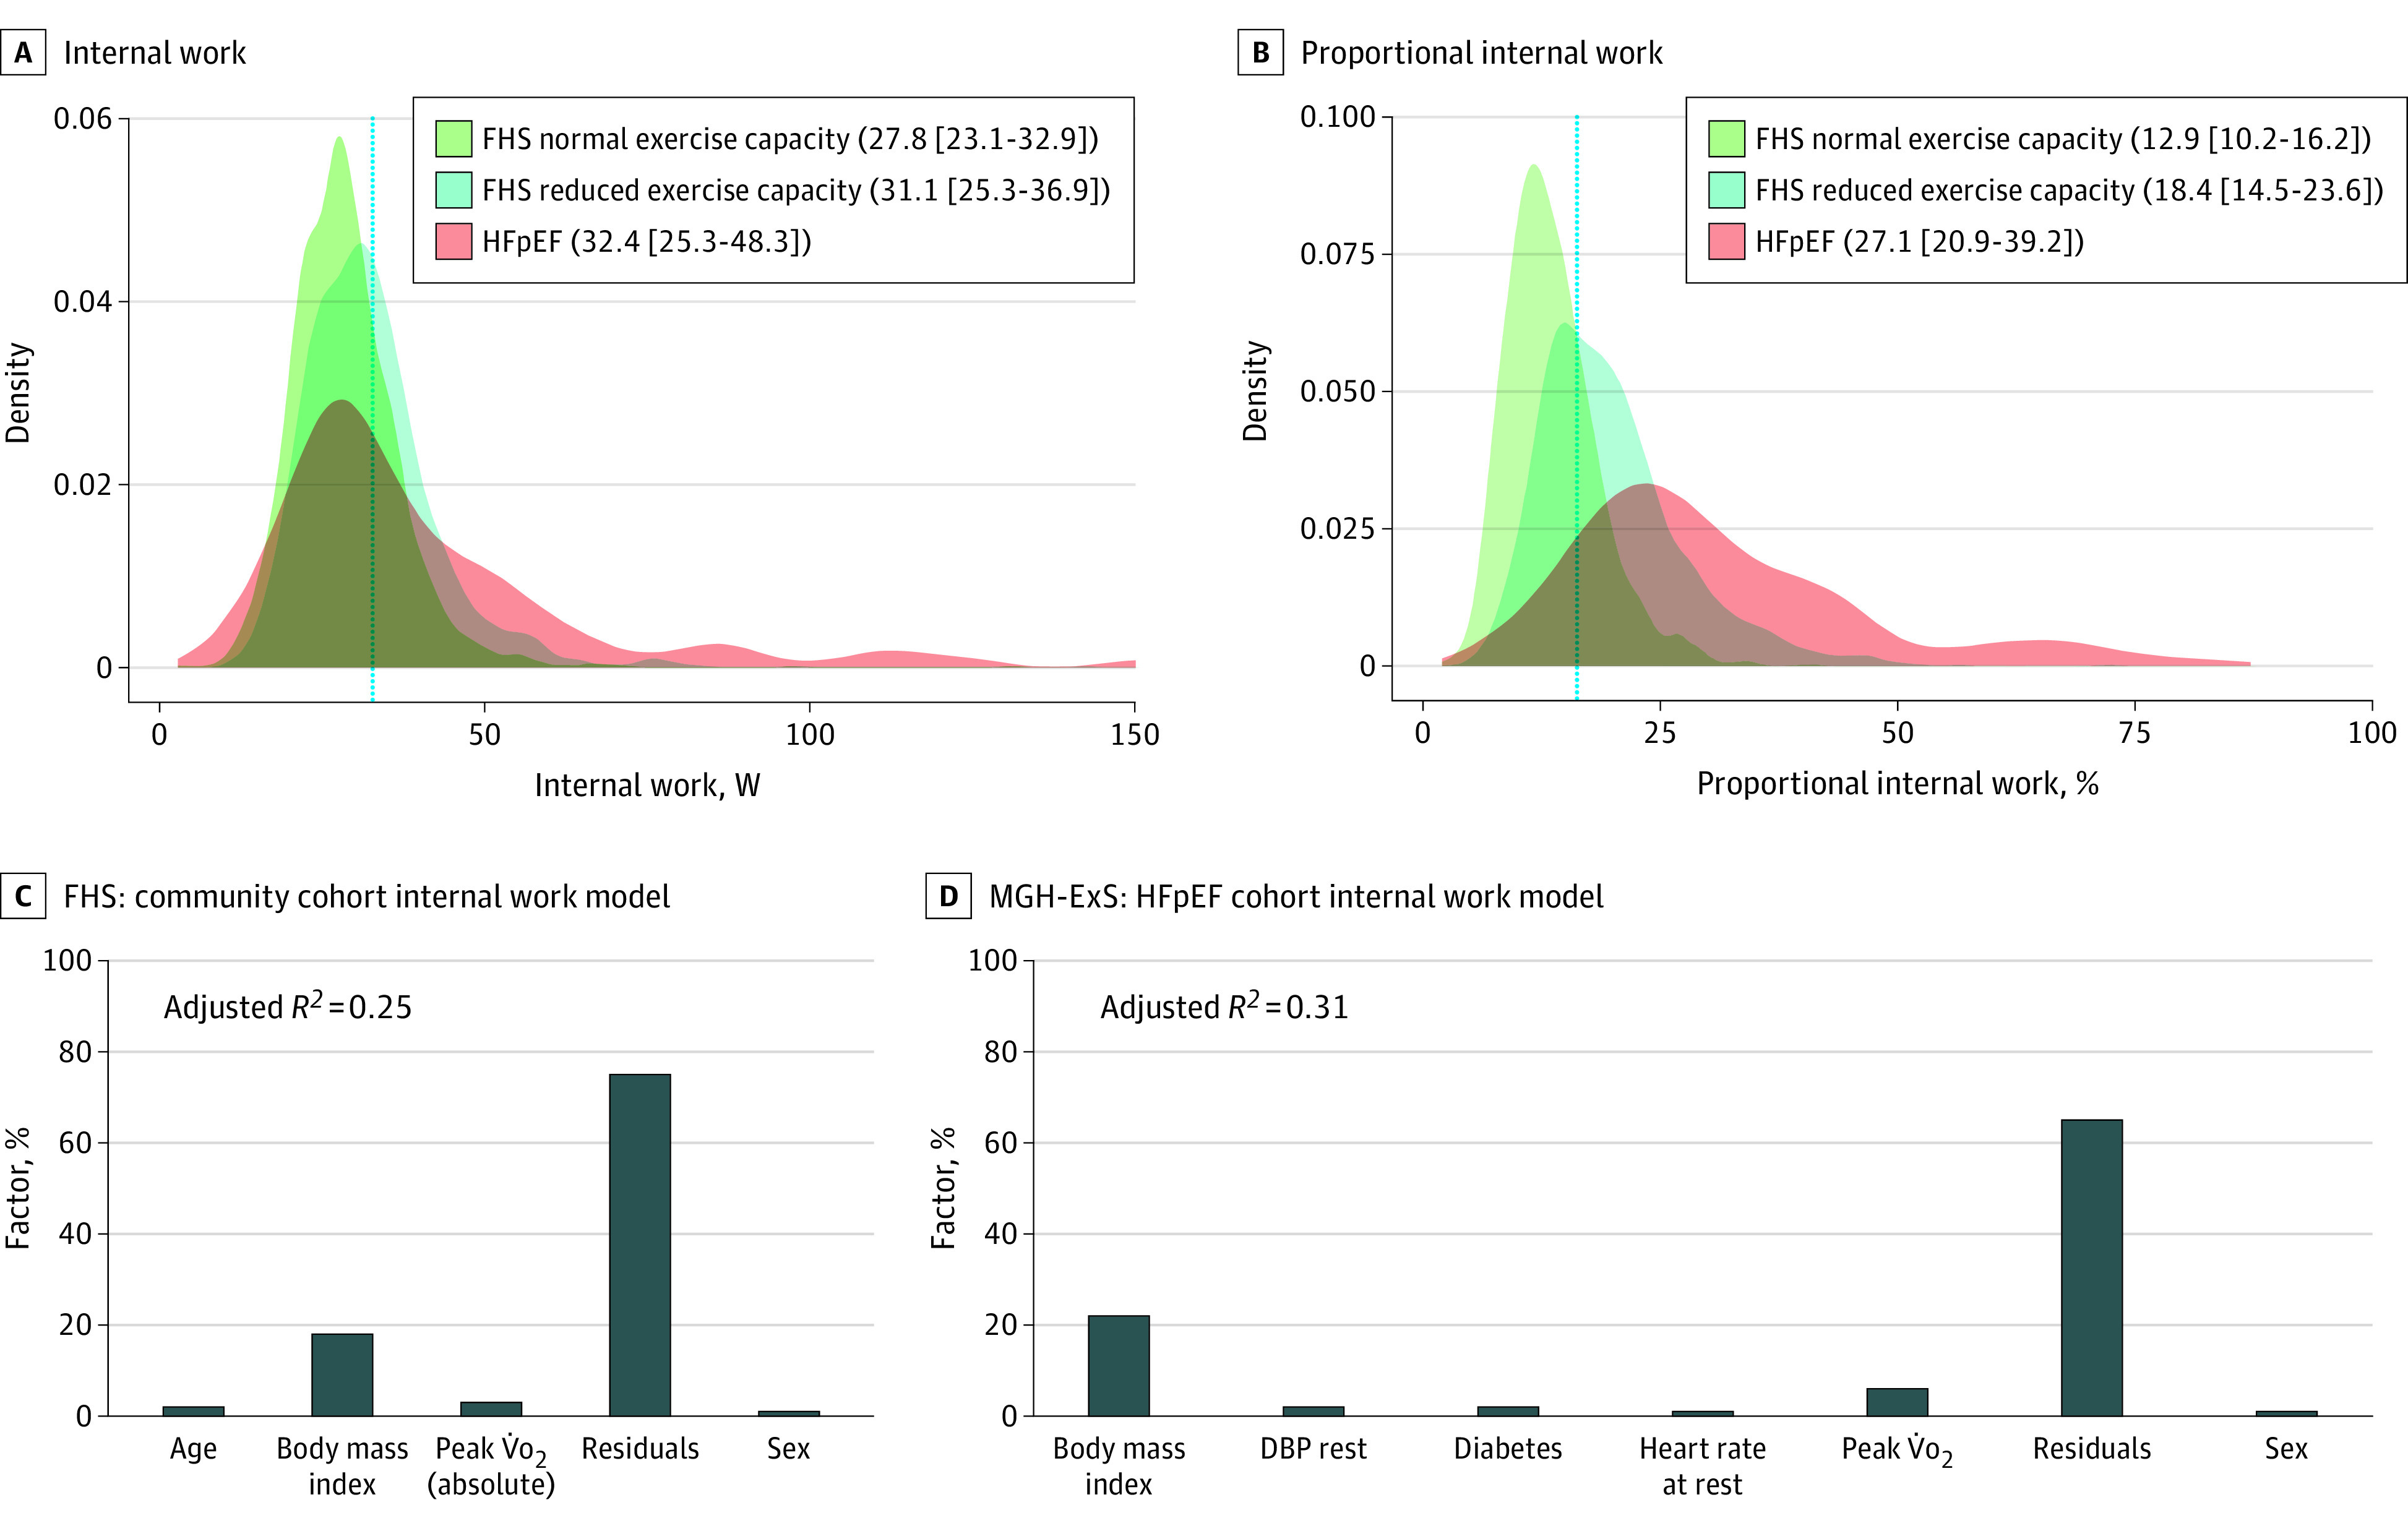
Figure 2. Internal Work in the FHS and in HFpEF.

A, Distribution of internal work in Framingham Heart Study (FHS) participants and individuals with heart failure with preserved ejection fraction (HFpEF) displayed as a density function, with normal exercise capacity defined as 90% or more of predicted peak V̇o2. Panel B shows a similar figure for proportional internal work. The numbers in the legend show the median (interquartile range) of each measure in the different subsamples. The dotted vertical lines in panels A and B represent the 75th percentile of internal work (A) or proportional internal work (B) of the FHS normal exercise capacity distribution. Panels C and D show internal work variance explained by each covariate. Covariates without more than 1% variance explained (after rounding) were not included here. Massachusetts General Hospital Exercise Study (MGH-ExS) models used in panel D did not include resting cardiac output or filling pressures. DBP indicates diastolic blood pressure.
