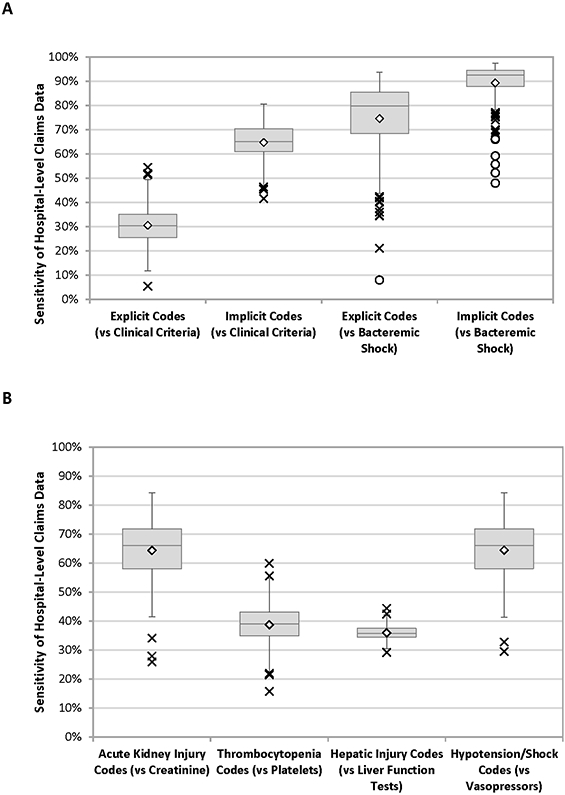
Figure 1. Sensitivity of A) sepsis codes and B) organ dysfunction codes relative to clinical criteria.

Boxes indicate the median hospital sensitivity (middle line), 25th quartile (lower box line), and 75th quartile (upper box line). Diamonds indicate the mean hospital sensitivity. Outliers are indicated by X (near outliers) and O (far outliers), as defined by values more than 1.5 times the interquartile range from the interior quartile boxes. The organ dysfunction comparisons in Figure 1B were conducted in hospitalizations with ≥1 blood culture draw.
