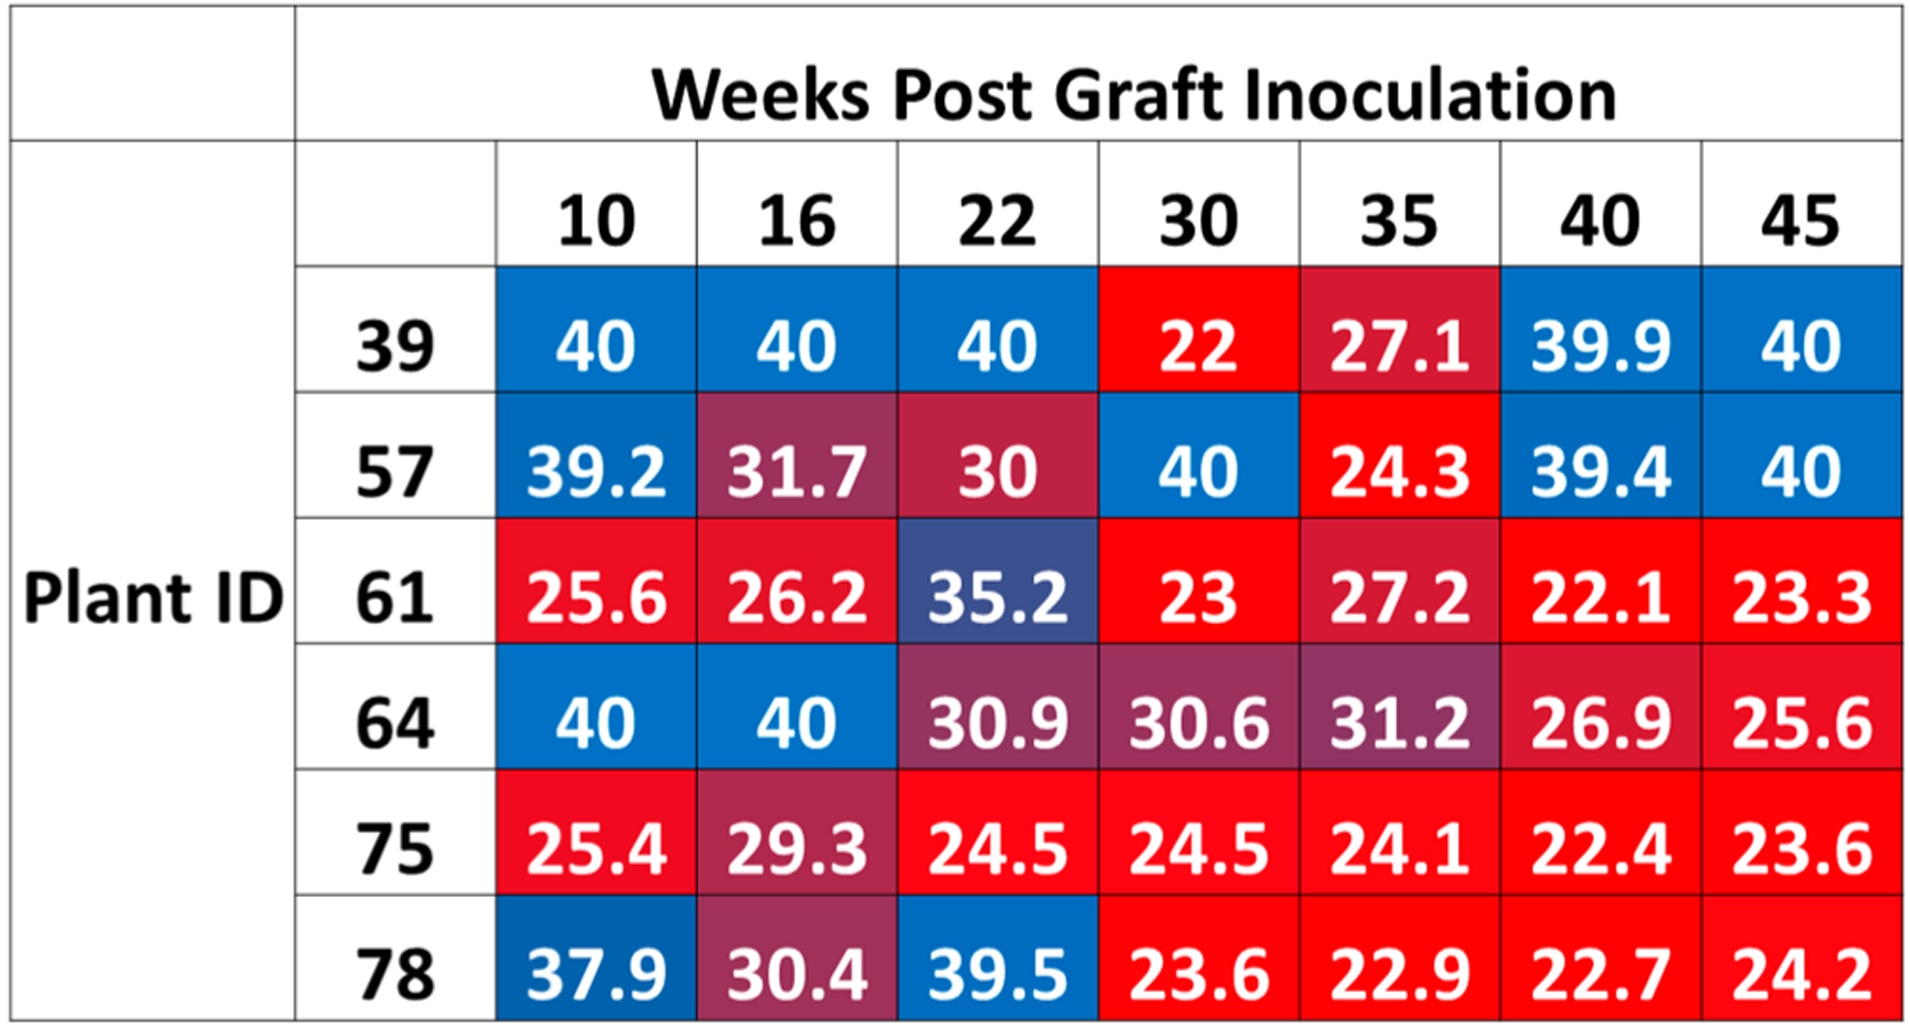
Figure 1.

CLas qPCR data obtained from CLas grafted lemon trees. Cycle threshold (Ct) values are given at each time point for each of the five infected lemon trees analyzed in this study. In this heat map representation, red indicates high CLas titer, while blue indicates that the CLas titer is at or below the limit of detection.
