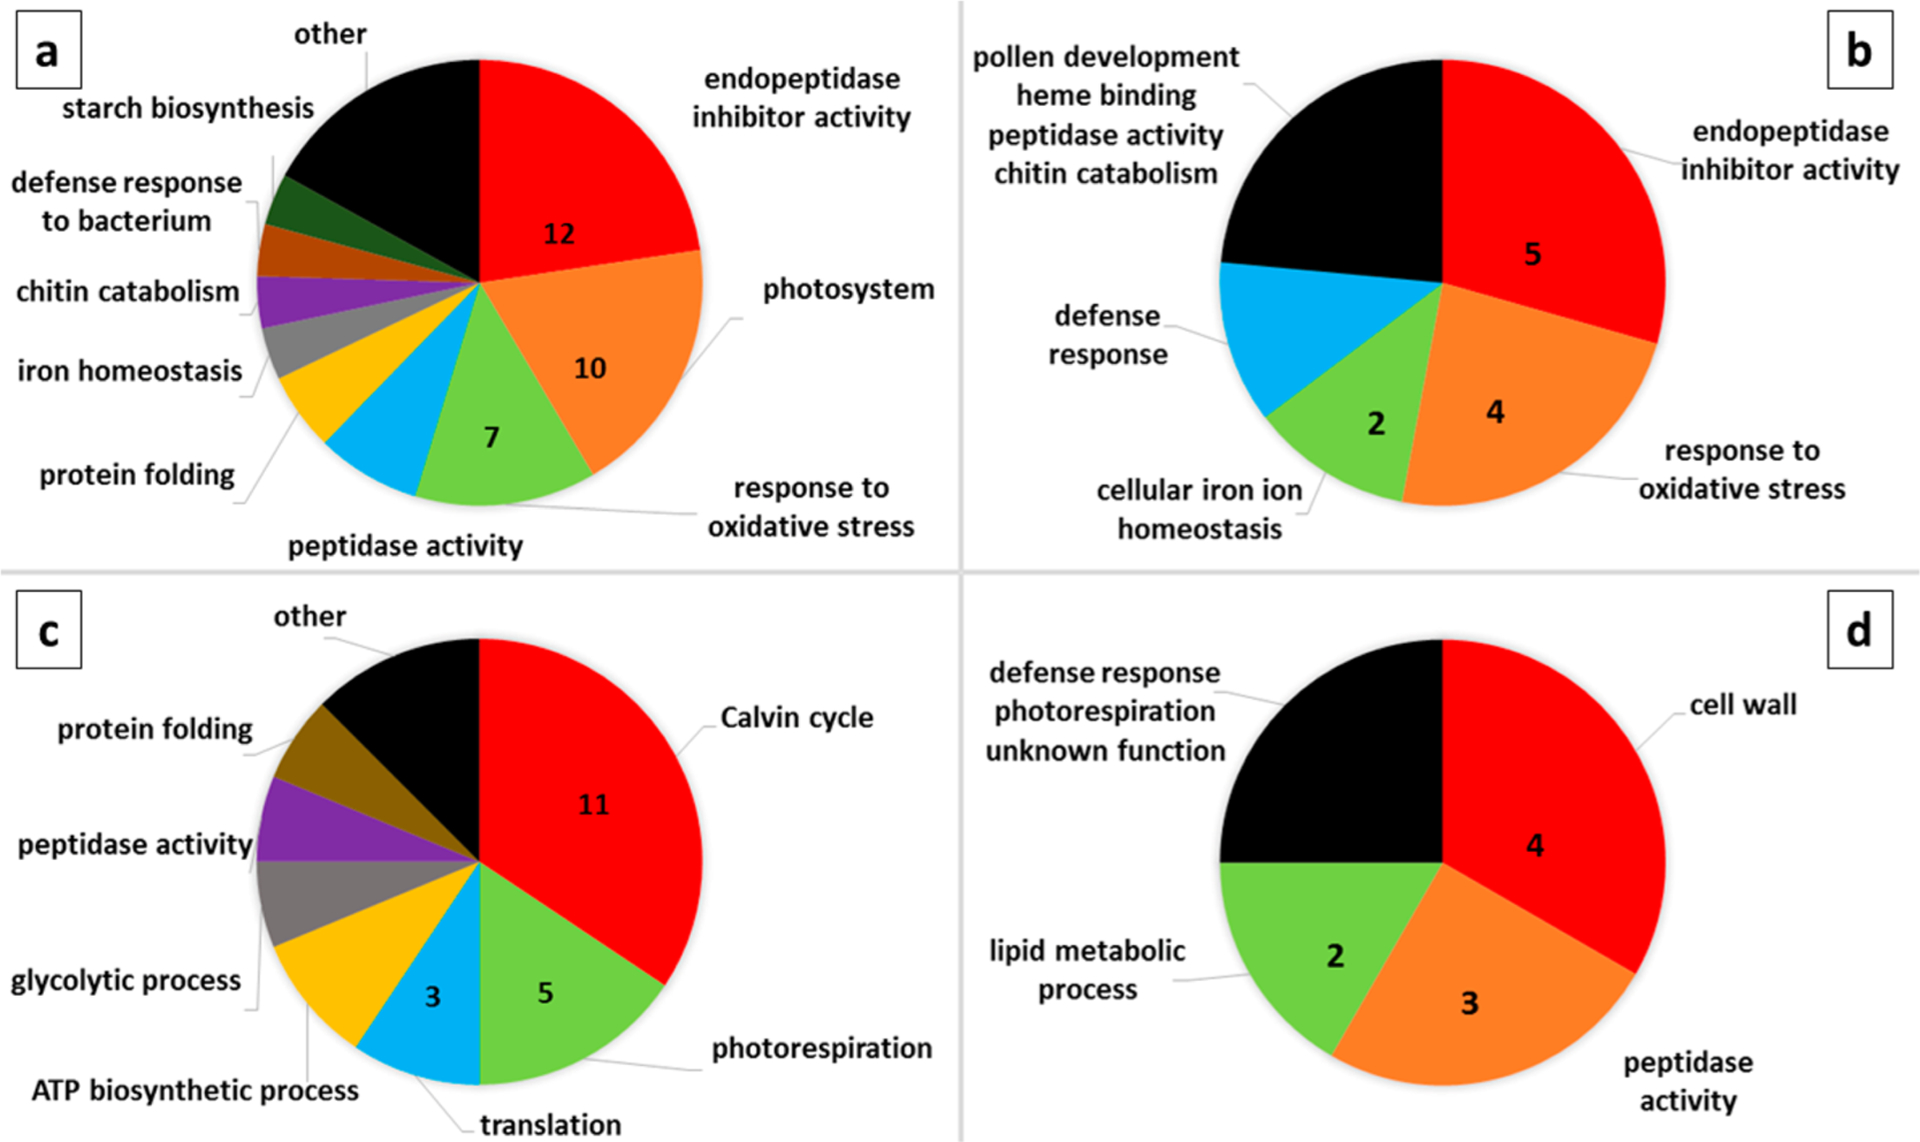
Figure 3.

Pie chart representation of the proportion of lemon proteins with shared predicted biological function, out of all proteins found to be differentially abundant between healthy and CLas infected plants at that time point. The number of differentially abundant proteins belonging to the three most common functional classes are indicated for each of the four groups: more abundant in CLas infected plants at (a) 10 weeks post graft, and (b) 14 weeks post graft; and less abundant in CLas infected plants at (c) 10 weeks post graft, and (d) 14 weeks post graft. The black segment of each pie chart includes the functional classes represented by one protein.
