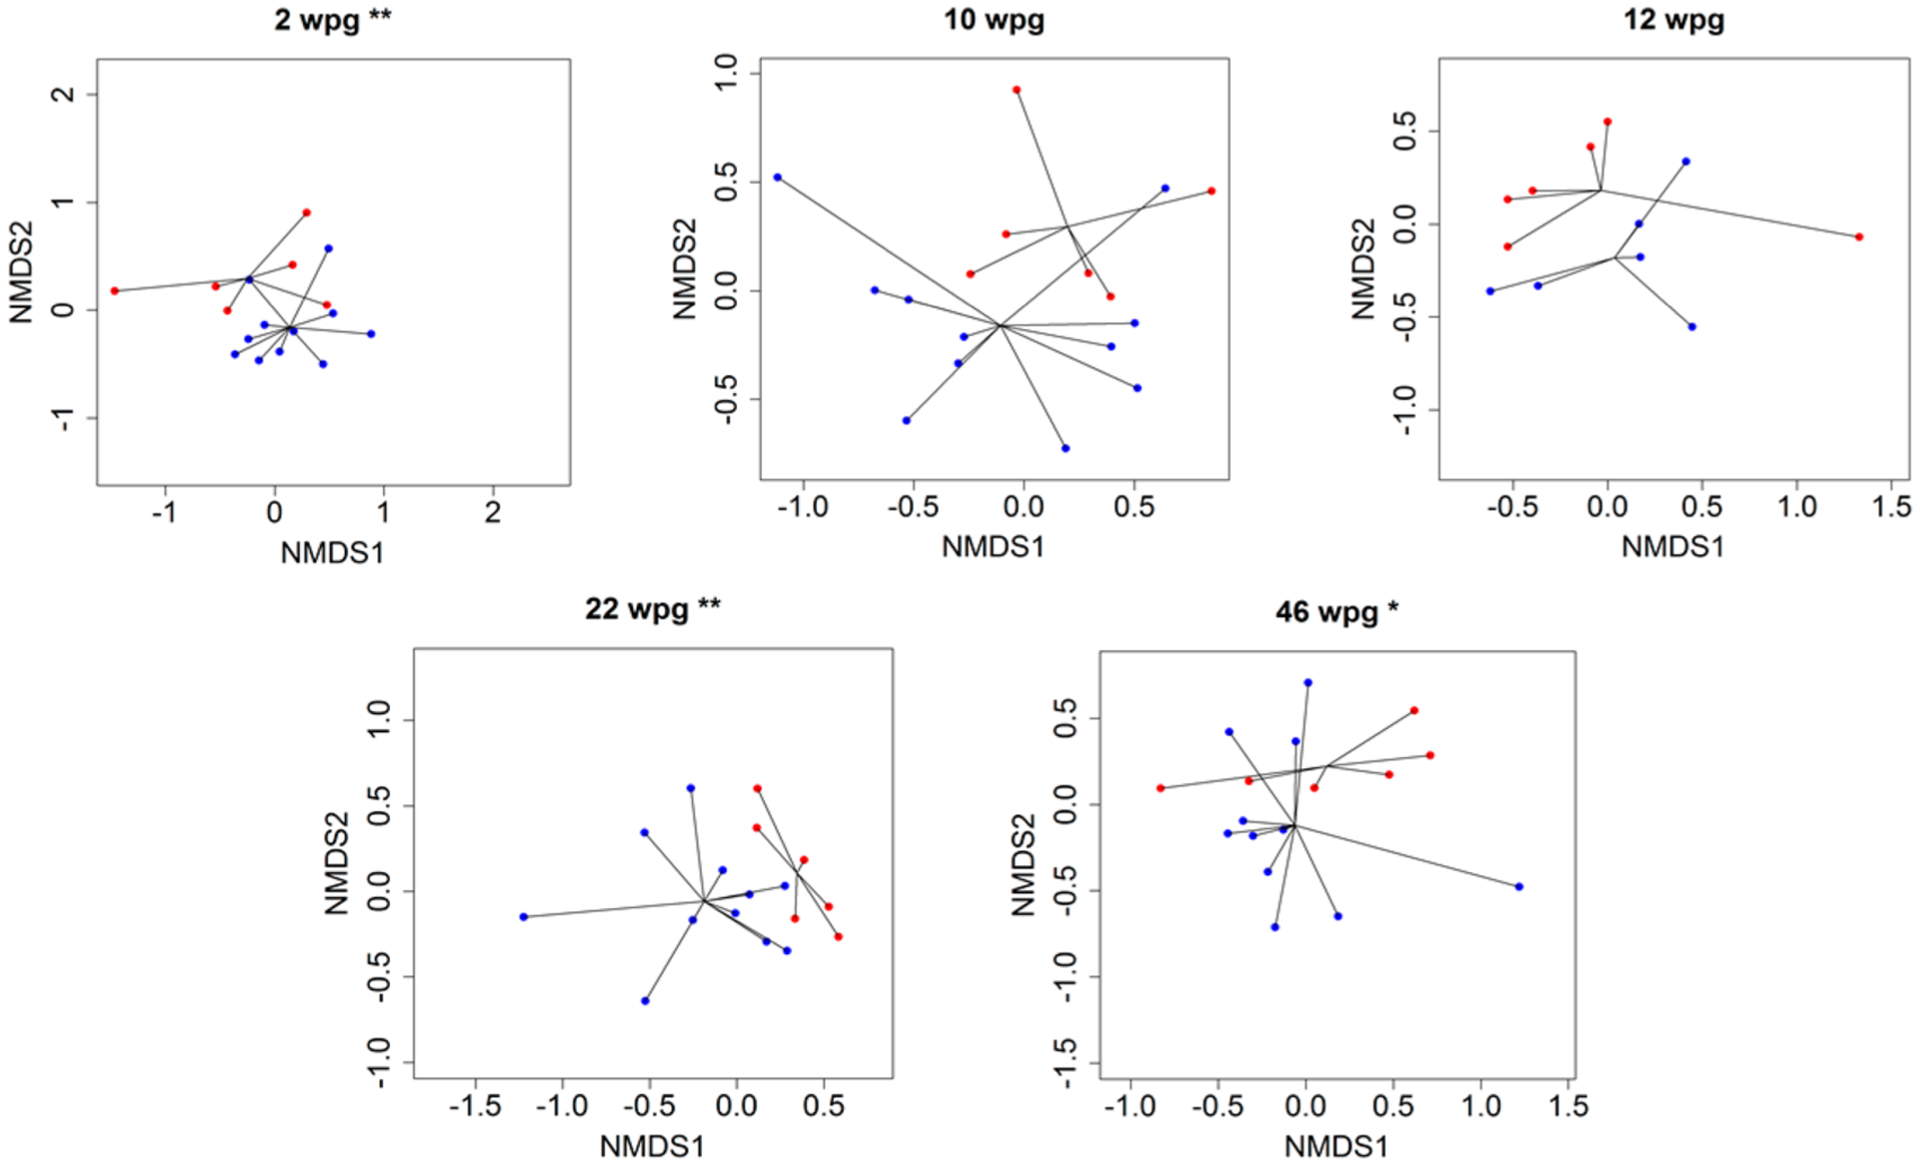
Figure 4.

Nonmetric multidimensional scaling (NMDS) ordination plots based on Euclidean distance matrices of metabolomic samples at 2, 10, 12, 22, and 46 weeks postgrafting for control (blue) and red (CLas+) samples. Lines are extending from the centroid of each group. Asterisks indicate significant differences between the centroids of the two clusters **p ≤ 0.05; *p ≤ 0.1.
