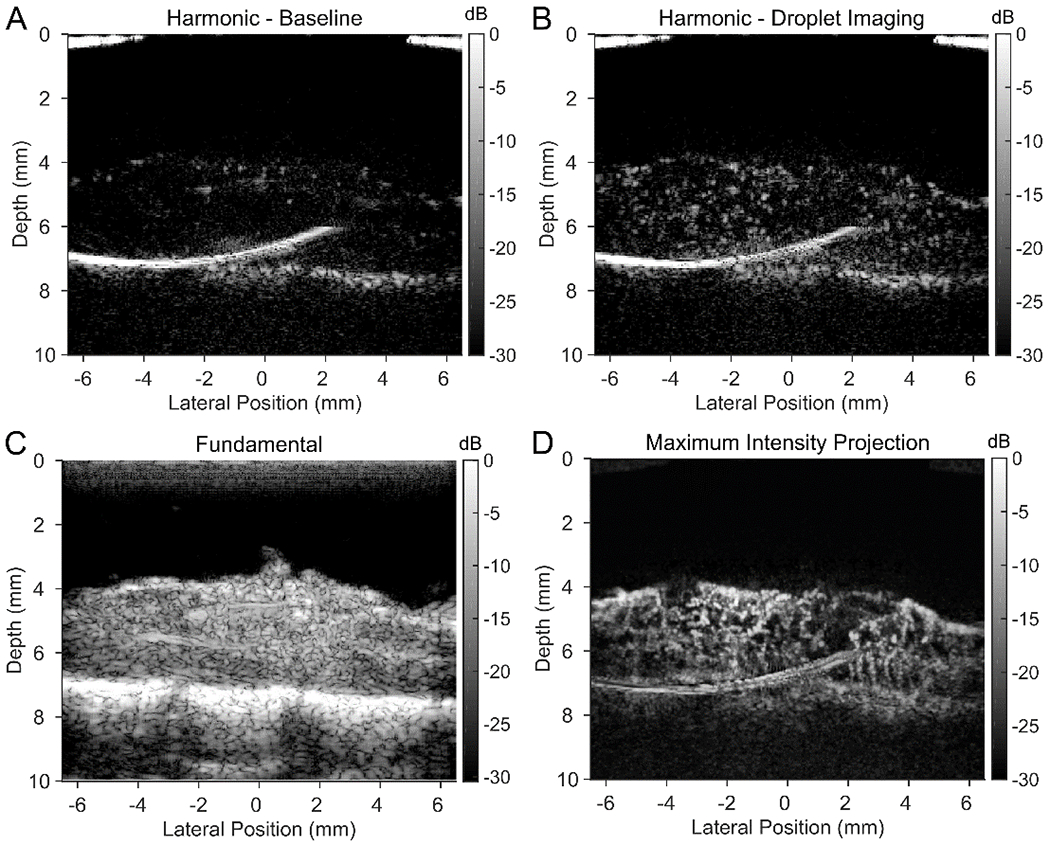
Figure 5:

The spinal cord of a rat model was imaged using a 15 MHz linear array. A bolus injection of perfluorobutane droplets active in the region of interest was highlighted using plane-wave harmonic imaging (A and B) in conjunction with conventional ultrasound imaging (C). (A) Prior to injection, harmonic imaging reveals no contrast, confirming the absence of bubbles. (B) Seconds after injection, individual activated droplets are seen passing through the spinal cord vasculature. (D) After performing a maximum intensity projection of perfusing activated droplets (i.e., bubbles), microvessels were traced out over the image region. See supplemental media for video of activated droplets perfusing the spinal cord using harmonic imaging.
