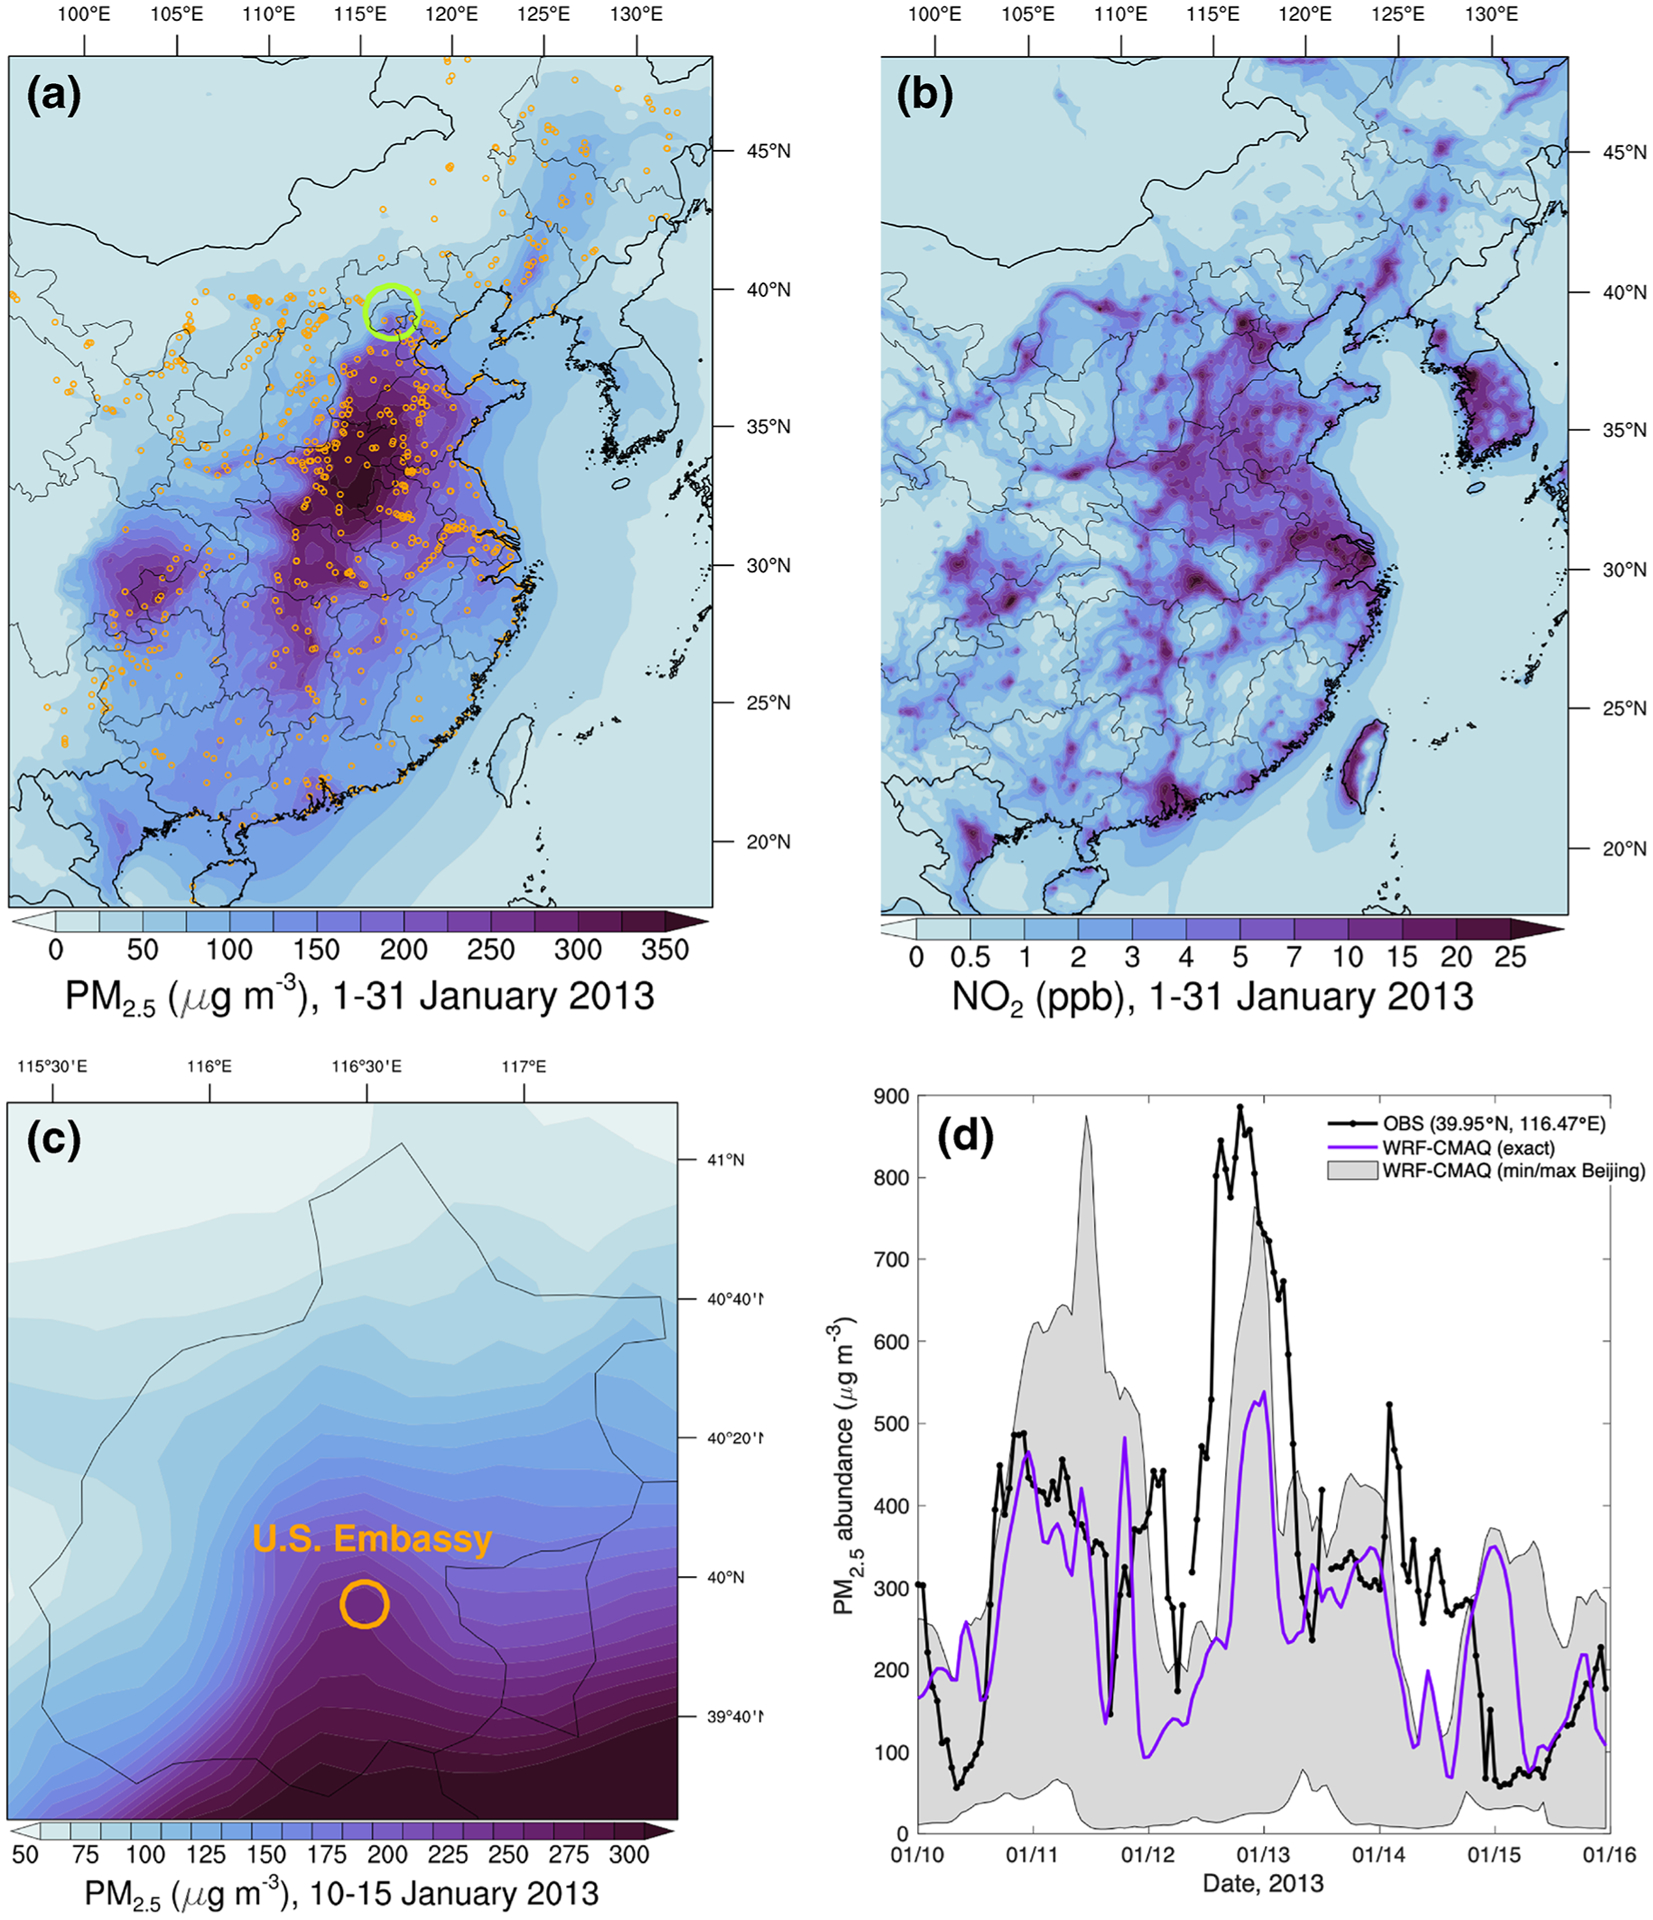
Figure 2.

Summary of surface PM2.5 for the January 2013 pollution episode over China. (a) Modeled monthly mean PM2.5 concentrations in BASE over the model domain. The Beijing province is denoted by the green circle, and the orange dots are the location of coal-fired EGUs, (b) as (a) but for NO2, (c) Modeled peak episode (10–15 Jan) concentrations over Beijing. (d) Time series of hourly PM2.5 abundance observed at the U.S. Embassy (orange in [c]), the model grid cell that contains the Embassy, and the min/max of all grid cells inside Beijing.
