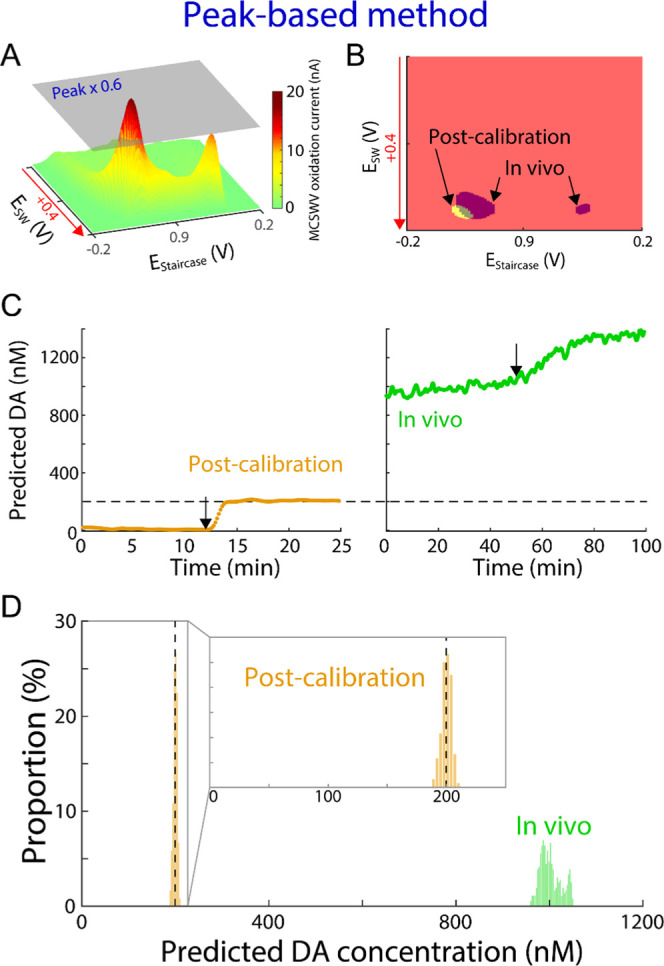
Figure 2.

Processing DA kernel and prediction of DA levels by peak-based method. (A) Example of three-dimensional illustration of MCSWV oxidation currents with 200 nM of DA in vitro (i.e., post-calibration). (B) DA kernel for the representative in vitro post-calibration recording shown in (A) (yellow) and an in vivo recording (purple). (C) Example of DA concentration predictions using the peak-based method for the post-calibration (left, orange) and the in vivo recording (green, right). Arrows represent DA injection for post-calibration and nomifensine administration in vivo; the dashed line indicates injected DA concentration in post-calibration. (D) Distributions of the predicted DA concentrations during the first 40 min and the last 15 min for the in vivo and in vitro post-calibration recordings in (C), respectively. Inset: enlarged x-axis scale matching to Figure 4D.
