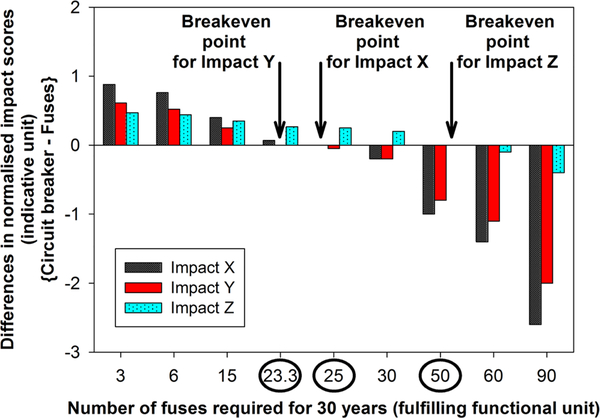
FIGURE 2.
Illustrative example of breakeven analysis with case of circuit breaker versus fuse systems (functional unit: to control an average current of 1 A and shut down when the limit of 6 A is exceeded or in case of short circuits for 30 years). The tested parameter in the analysis is the number of breakdowns per year (translated into the number of fuses over 30 years, as represented on x-axis), for which the circuit breaker becomes more beneficial than fuses (breakeven points circled in x-axis). The fictional dataset pertaining to the illustrative graph is available in the Supporting Information

