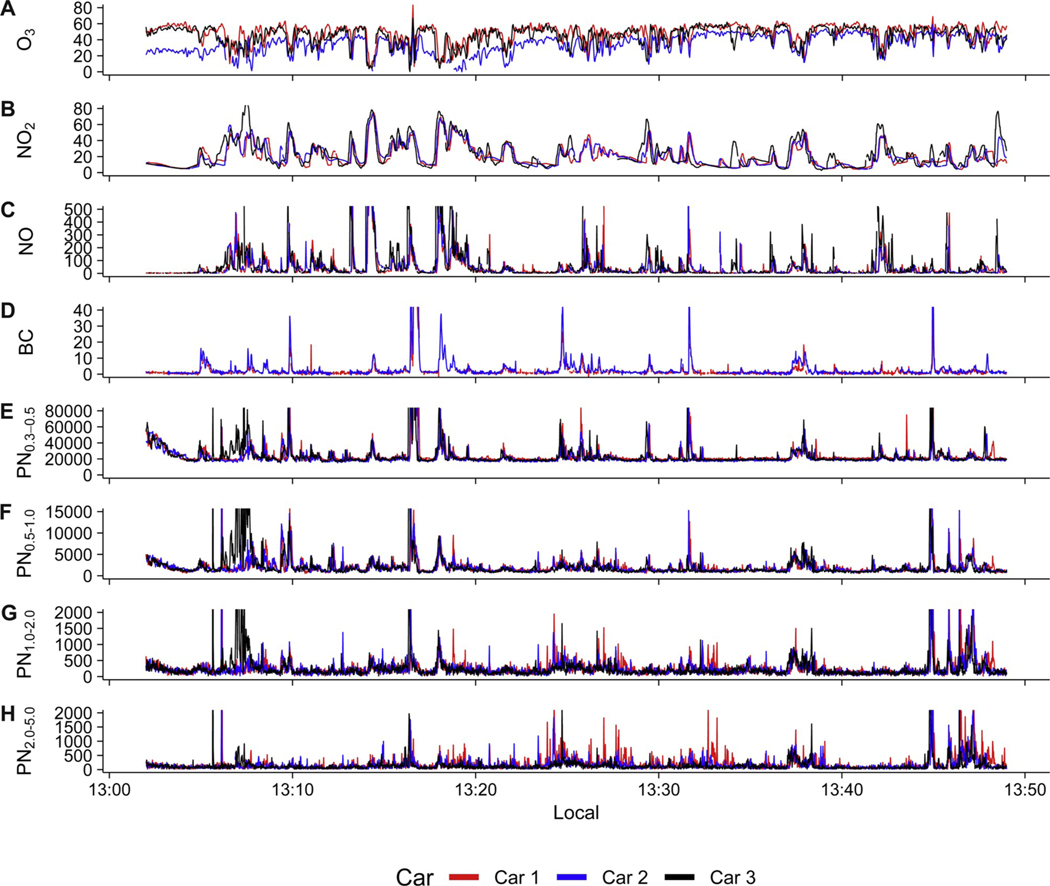
Fig. 2.
Representative pollutant timeseries from period MC-05, showing (A) O3, (B) NO2, (C) NO, (D) BC, (E) PN0.3–0.5, (F) PN0.5–1.0, (G) PN1.0–2.0, and (H) PN2.0–5.0, for the three cars (two cars for BC). The y axis is truncated arbitrarily to enable a better representation of baseline variations in pollutants rather than focusing on a few minor high-lying outlier points.

