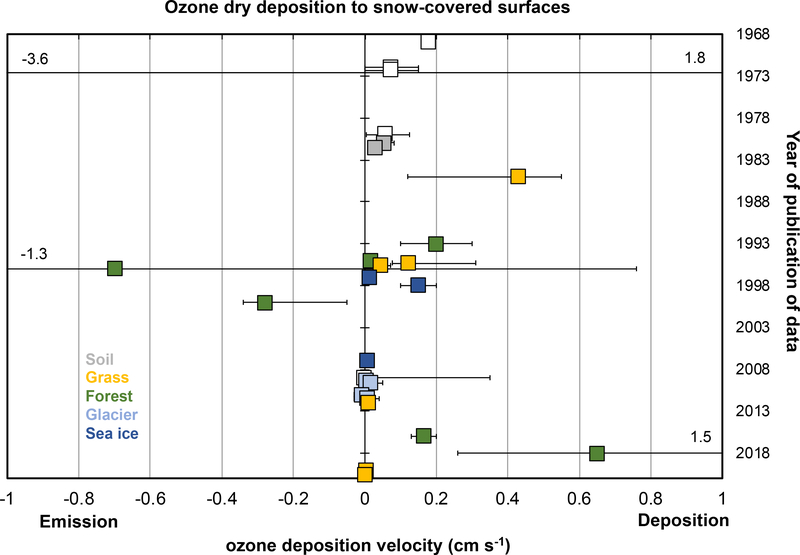
Figure 7.
Range of ozone deposition velocities observed or inferred from observations over snow-covered surfaces. The vertical order of symbols reflects the year of the publication featuring the data (we impose small y-axis shifts for multiple years with publications). Colors indicate land use/land cover type underneath the snow. Symbols without color indicate unspecified underlying land use/land cover type or laboratory measurements. Error bars are the range of reported values, except for the forest point with 0.017 cm s−1 for which the error bars are one standard deviation. Numbers represent the value of the error bar cut off by the x-axis range. Figure is adapted from Helmig, Ganzeveld, Butler, et al. (2007). Data included are laboratory studies (Aldaz, 1969; Galbally & Roy, 1980) and field studies from Mawson, Antarctica (Galbally & Allison, 1972), Mt. Buller, Australia (Galbally & Allison, 1972), Illinois (Wesely et al., 1981), Lancaster, England (Colbeck & Harrison, 1985), Camp Borden (Padro, 1993; Padro et al., 1992; Wu, Z., et al., 2016), GLEES Brooklyn Lake (Zeller, 2000; Zeller & Hehn, 1995, 1996), Central Plains Experimental Range (Stocker et al., 1995), Ice Camp Narwahl (Gong et al., 1997), Alert, Canada (Hopper et al., 1998), Arctic (Helmig, Bocquet, Cohen, et al., 2007), Bruneck in the Southern Alps (Cieslik, 2009), Summit Greenland (Bocquet et al., 2011; Helmig, Cohen, Bocquet, et al., 2009), Flanders (Neirynck & Verstaeten, 2018), and Horsepool in the Uintah Basin (unpublished).

