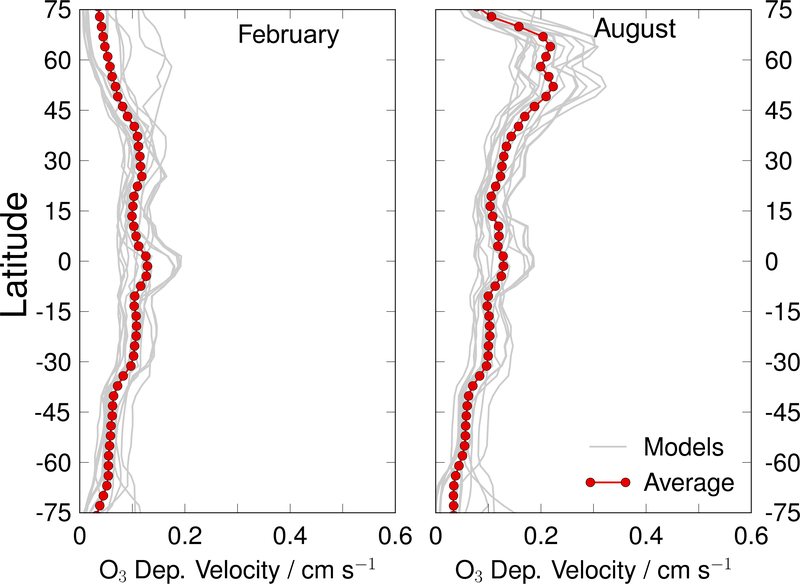
Figure 8.
Variation in ozone deposition velocity across an ensemble of global models, most of which identify as using the Wesely (1989) scheme. Latitudinal averages per three degrees latitude band are shown. Grey lines indicate individual models participating in the Task Force on Hemispheric Transport of Air Pollution model intercomparison. Red circles show the multimodel average. Figure is from Hardacre et al. (2015).

