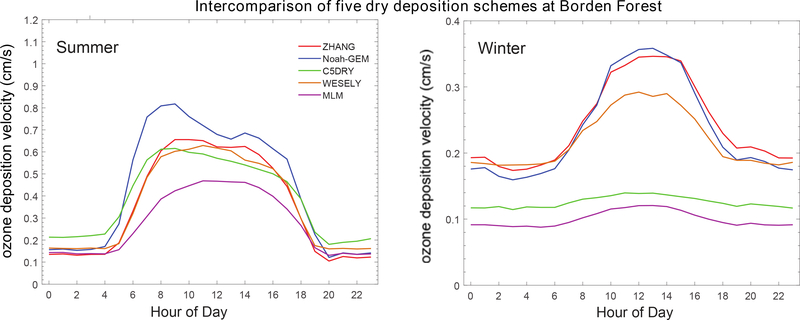
Figure 9.
Variation in simulated ozone deposition velocity across single-point models all driven by the same forcing data from Borden Forest in Ontario, Canada. Figure is adapted from Figure 1 of Z. Wu et al. (2018) with permission. © 2018. The Authors and Her Majesty the Queen in Right of Canada. This article has been contributed to by US Government employees and their work is in the public domain in the USA. This is an open access article under the terms of the Creative Commons Attribution-NonCommercial-NoDerivs License, which permits use and distribution in any medium, provided the original work is properly cited, the use is non-commercial and no modifications or adaptations are made.

