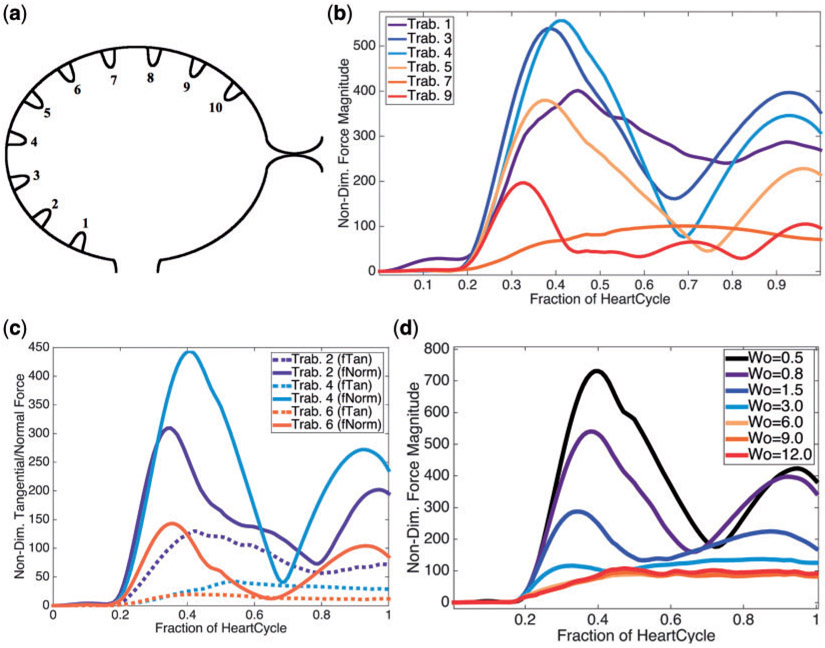
Fig. 6.
(a) Illustrating the indexing of trabeculae (b) Plot illustrating the average magnitude of the force on chosen trabeculae over the course of one heart cycle for Wo = 0.8, the biologically relevant case. (c) Plot showing the average magnitude of the tangential and normal forces at each time, for chosen trabeculae, during one heart cycle for Wo = 0.8. (d) A plot illustrating the average magnitude of force at each time-step for Wo ranging from 0.5 (half the biologically relevant case) to 12.0.

