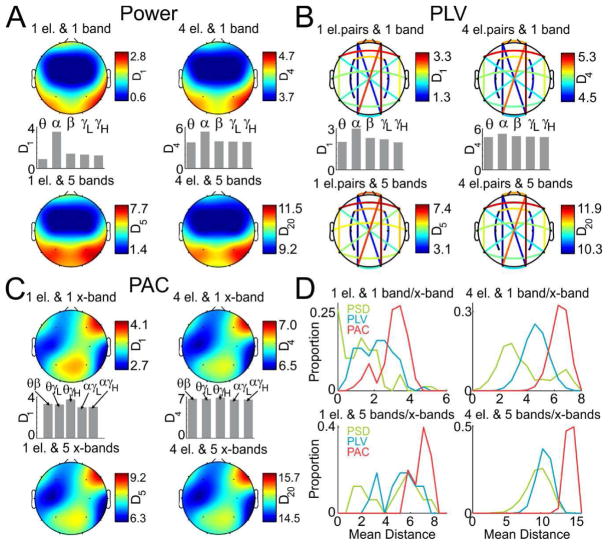
Fig. 3.
Discrimination using minimal montages and frequency bands. (A) Average Euclidean distance computed between the EEGs during all pairs of tasks using only the power data for all combinations of 1 electrode and 1 band (top, left), 1 electrode and 5 bands (bottom, left), 4 electrodes and 1 band (top, right) and 4 electrodes and 5 bands (bottom, right). The average distance for 5 bands of interest is shown for both options where only 1 band is selected. (B) Same as A, but for PLV (electrode pairs are used in PLV analysis instead of individual electrodes). (C) Same as B, but for PAC (cross-frequency bands x-bands are used in PAC analysis instead of regular frequency bands). (D) Histograms of distances between pairs of tasks for all combinations of electrodes and bands/x-bands.

