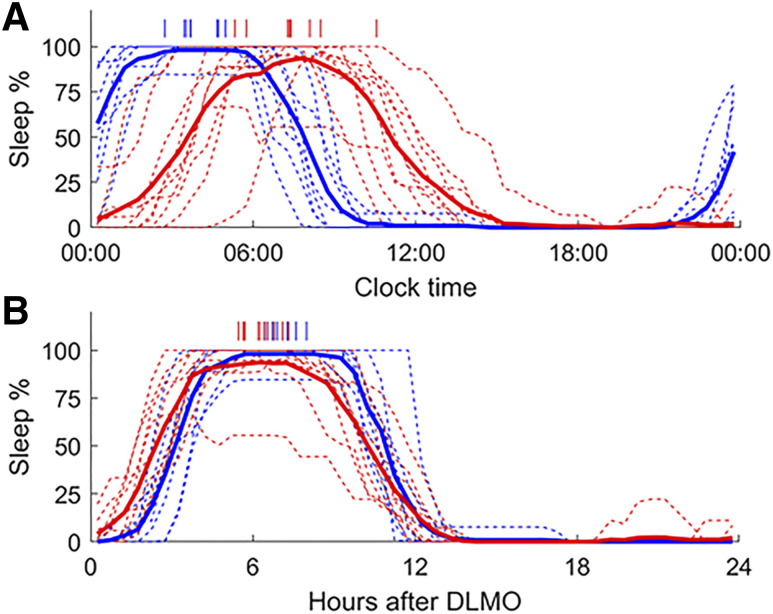
Figure 1. Daily sleep rhythms relative to clock time and DLMO.
Average daily sleep rhythms relative to clock time (A) and hours (B) after dim-light melatonin onset (DLMO). Data are shown for healthy controls (blue) and patients with Delayed Sleep Wake Phase Disorder (red). Individual sleep rhythms are shown as thin dashed lines, while group averages are shown as thick lines. Individual acrophases, based on cosinor fits, are indicated by vertical dashes at the top of each panel.

