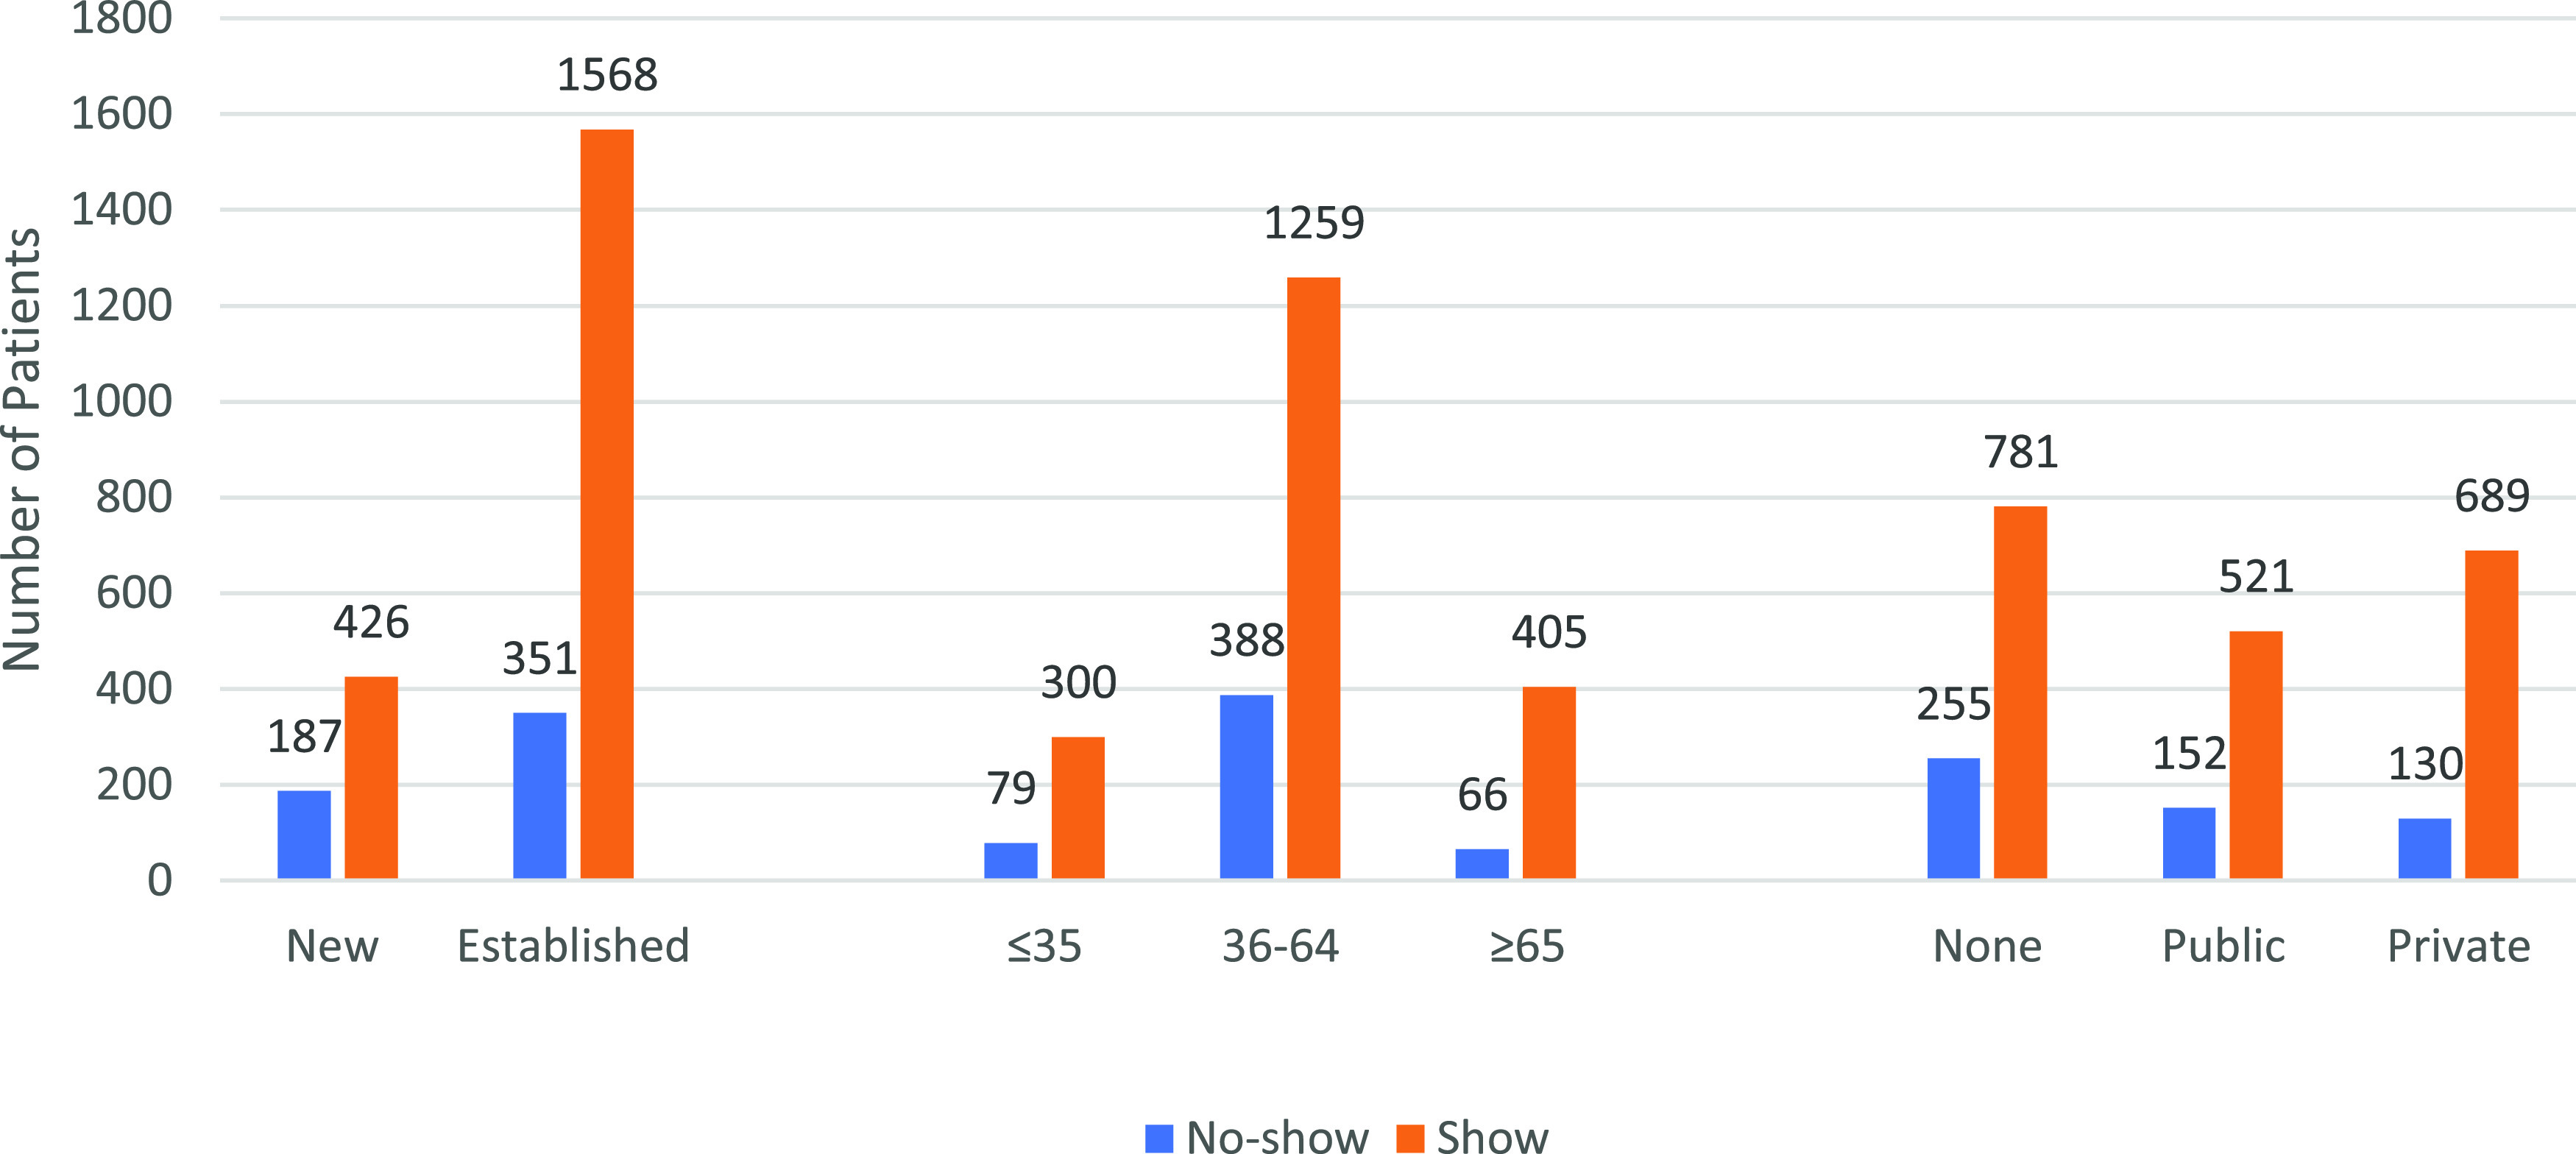
Figure 1. Appointment attendance based on appointment type, age category, and health insurance.

The bar graph illustrates the appointment attendance (number of patients who show vs no-show) based on appointment type (new vs established), age category, and type of health insurance coverage (none, public, or private). New patients were 1.96 times more likely to not show up than established patients. Age (≤35, 36–64, and ≥65 years) and appointment attendance (show vs no-show). Younger patients (≤ 35 years) were 1.53 times more likely to not show up than older patients aged 36–64 and ≥65 years. Type of insurance coverage and appointment attendance. Patients with no health insurance were 1.55 times more likely to not show up for a clinic visit than those with private or public health insurance. All statistical analysis showed P < .0001.
