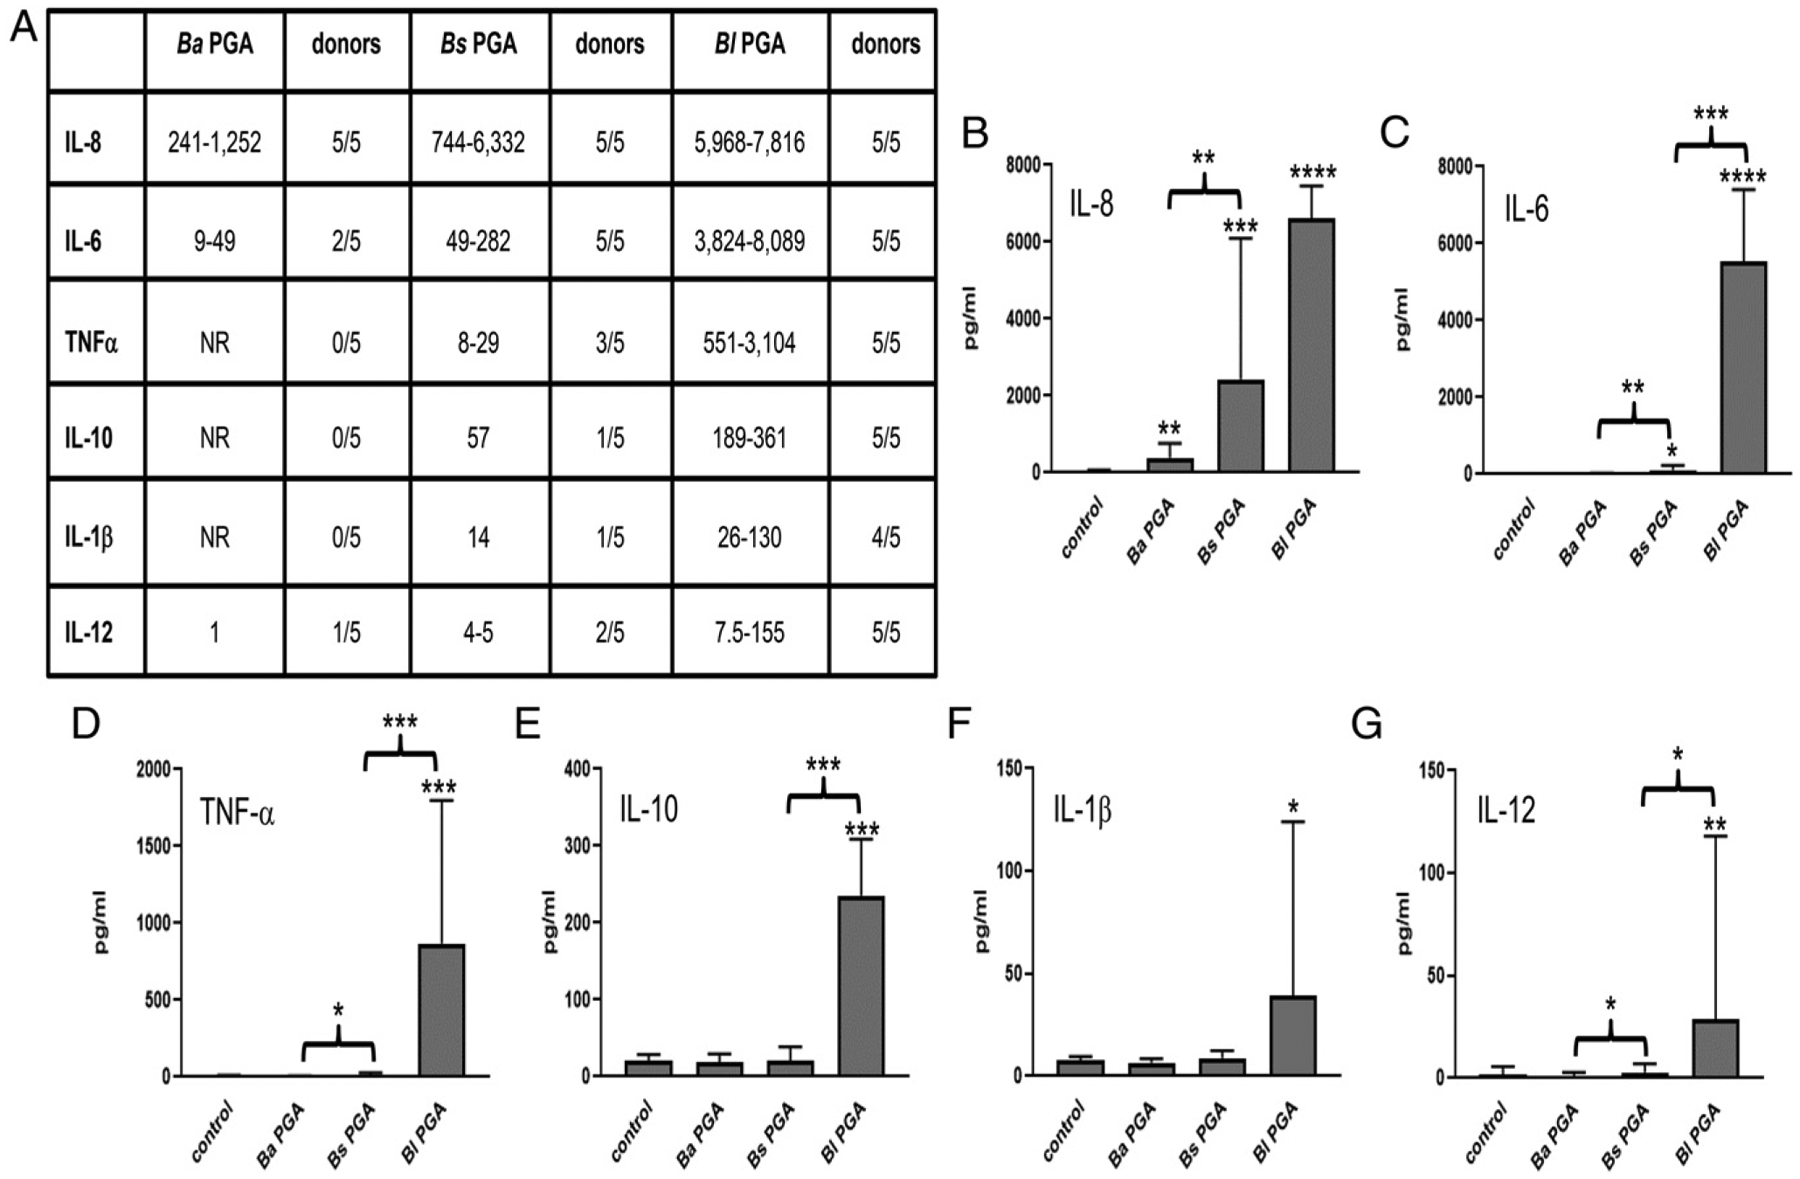
FIGURE 3.

PGAs from nonpathogenic B. subtilis and B. licheniformis elicit larger cytokine responses than B. anthracis PGA from human iDCs. iDCs were exposed to 500 μg/ml B. anthracis PGA, B. subtilis PGA, or B. licheniformis PGA or to medium alone (control). Media samples were analyzed for cytokines. An increase of ≥50% over the unstimulated control was considered a response. Five experiments were run using cells from five donors (n = 5). (A) The range of individual responses for each cytokine are presented in picograms per milliliter plus the number of donors that had a response. NR, no response. (B–G) Data are presented as geometric means in picograms per milliliter ± geometric SD (n = 5) for IL-8 (B), IL-6 (C), TNF-α (D), IL-10 (E), IL-1β (F), and IL-12p70 (G). Statistical significance of the responses to each PGA compared with control and of the differences in responses to the PGAs were determined by paired t tests of the log transformed data. *p < 0.05, **p < 0.01, ***p < 0.001, ****p < 0.0001. Ba, B. anthracis; Bl, B. licheniformis; Bs, B. subtilis.
