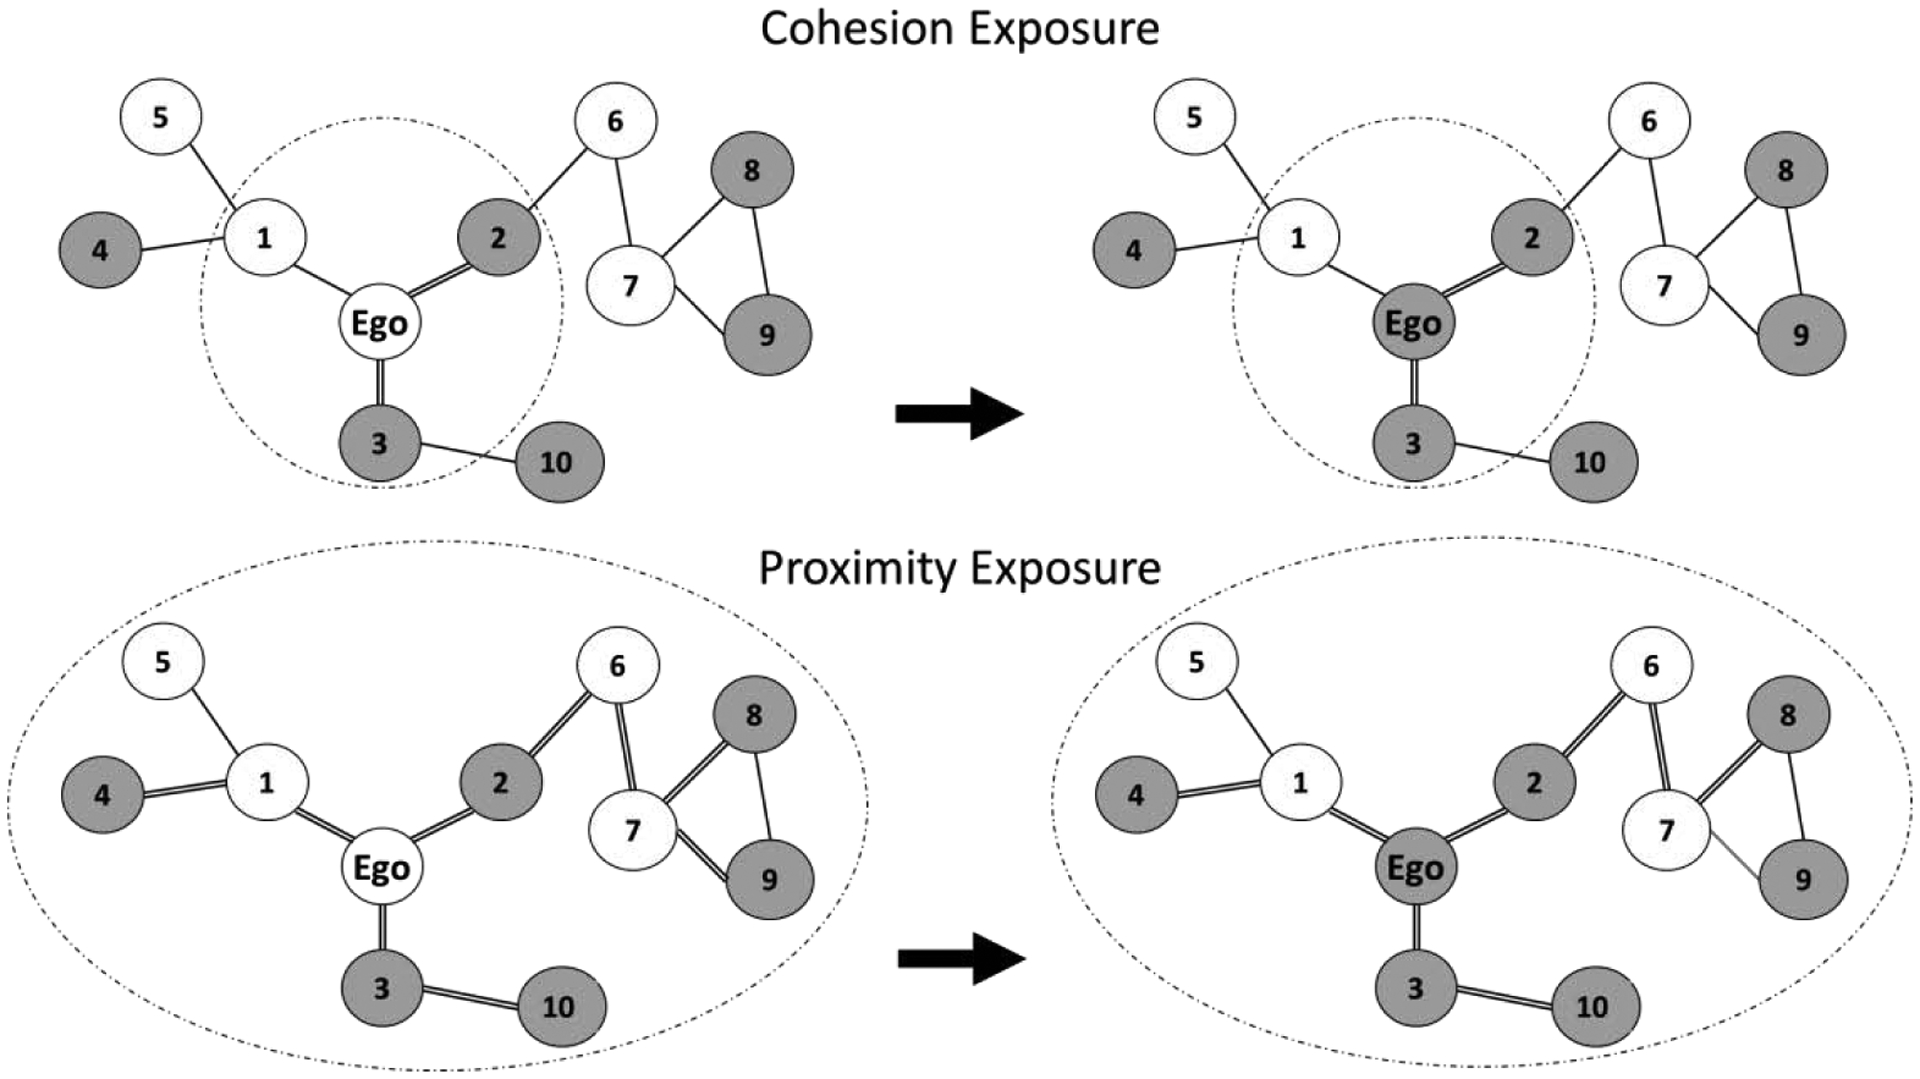
Figure 1. Presentation of cohesion exposure and proximity exposure as mechanisms of contagion.

Grey nodes indicate smokers, while white nodes indicate nonsmokers. Double-lines indicate connections being considered when measuring cohesion and proximity exposures. Dashed boundary indicates boundary of the network being considered when measuring cohesion and proximity exposures.
