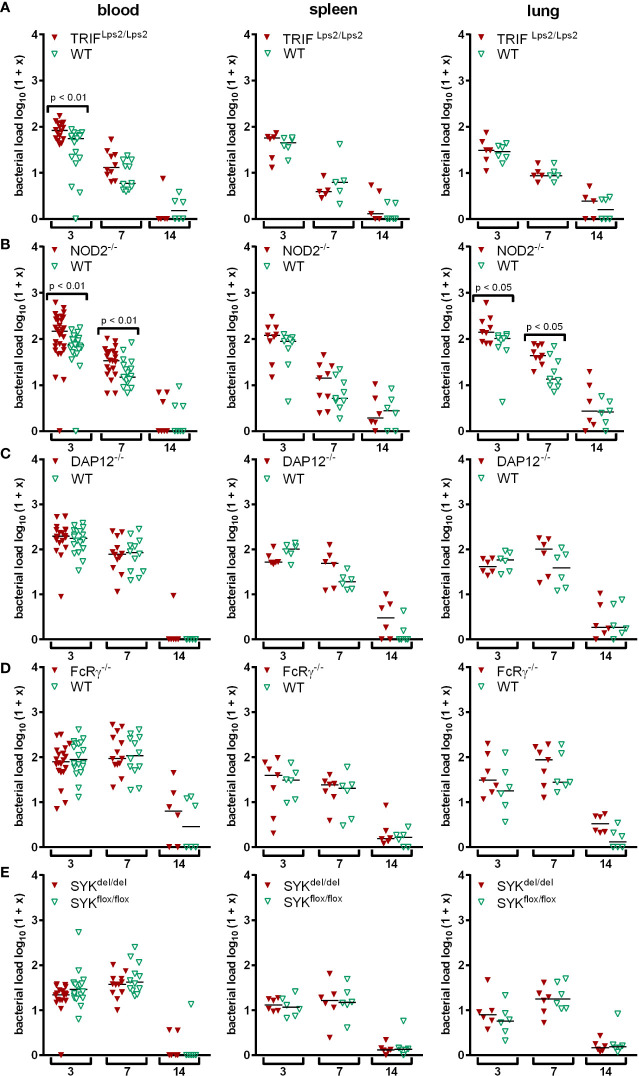
Figure 1.
Mice were infected i.p. with A. phagocytophilum. Blood, spleen and lung were collected at the indicated day p.i. and their bacterial load was measured by quantitative PCR. Each data point stands for one individual mouse. The bars represent the median. Data from 2 (A, C, D, E) and 3 (B) independent experiments are shown, respectively. Differences between gene-deficient and control mice were analyzed using the two-tailed Mann-Whitney test.

