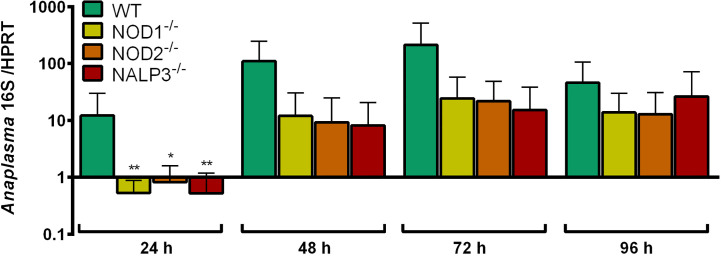
Figure 8.
Increase of A. phagocytophilum 16S rRNA relative to murine HPRT mRNA at different time points p.i. in WT, NOD1-/-, NOD2-/-, and NALP3-/- Hoxb8 neutrophils. Results were normalized to the respective 0 h value of each sample using the ΔΔCt-method. Mean and SD from four independent experiments are shown. Differences between experimental groups were analyzed using the two-tailed Mann–Whitney test. The following groups were compared: WT and the respective gene-deficient Hoxb8 neutrophils at each time point. *p < 0.05 **p < 0.01.

