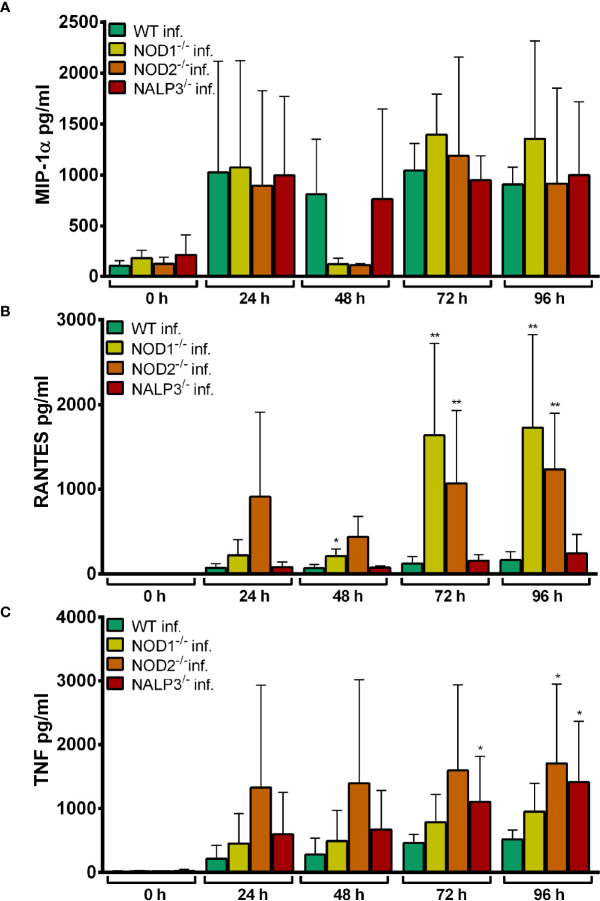
Figure 9.
MIP-1α (A), RANTES (B) and TNF (C) production in WT, NOD1-/-, NOD2-/-, and NALP3-/- Hoxb8 neutrophils at different time points after A. phagocytophilum infection. MIP-1α, RANTES and TNF were measured in the supernatants using CBA assay. Mean and SD from five independent experiments are shown. Differences between the respective gene-deficient Hoxb8 neutrophils and WT control cells at each time point were analyzed using the two-tailed Mann–Whitney test. *p < 0.05, **p < 0.01.

