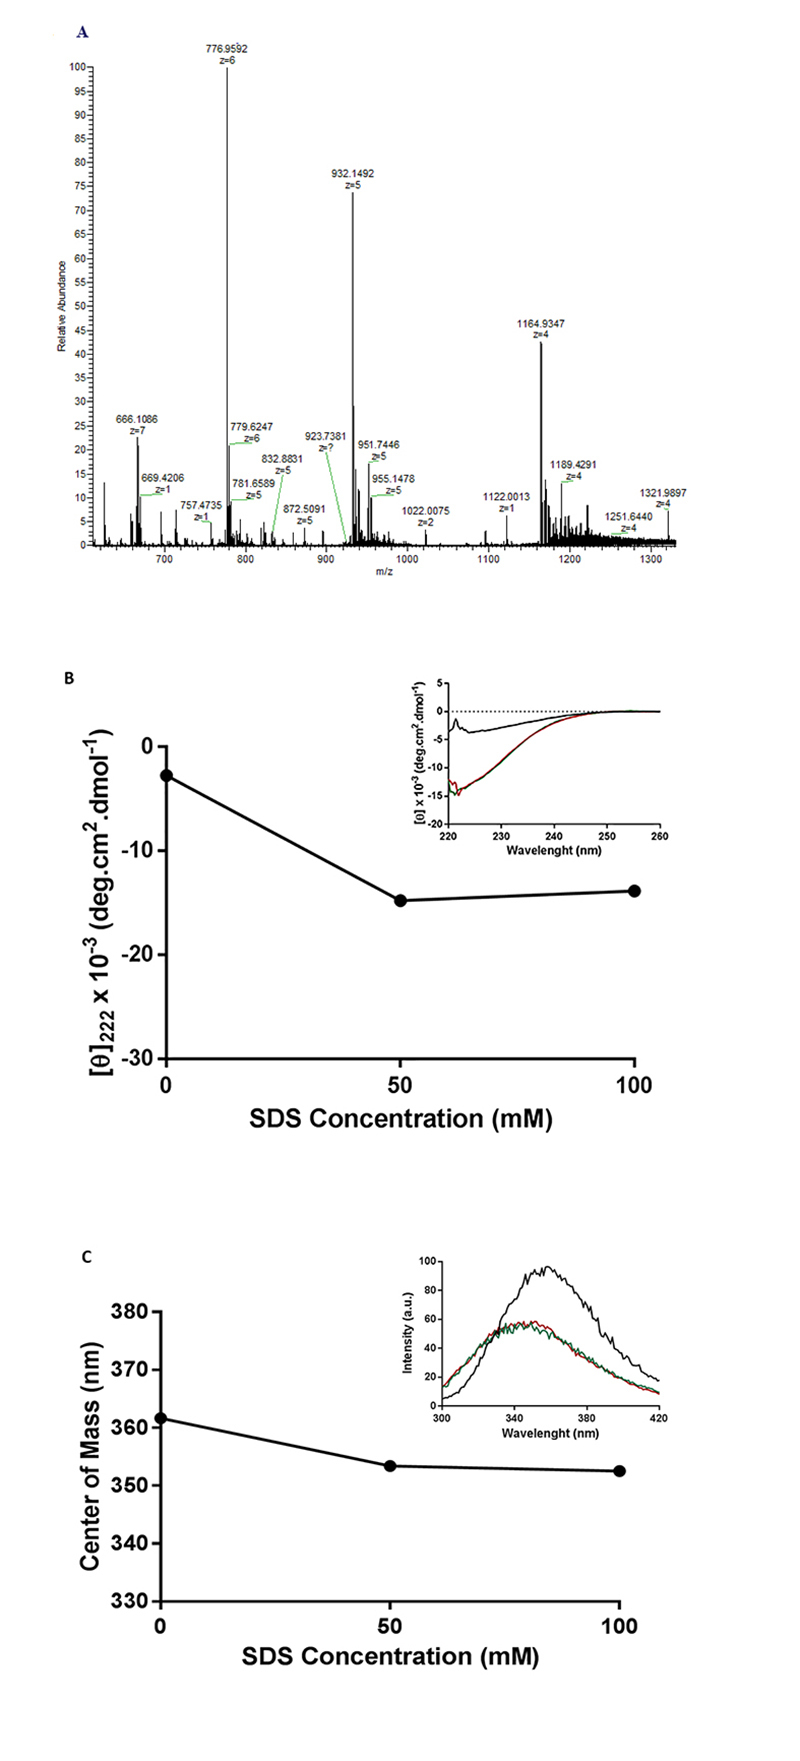
Figure 6. HRMS and secondary structure assays of AgCecropB. (A) Mass spectrum chromatogram of purified recombinant cecropin B. On the X axis, the detected fragments and their charge in the spectrum are identified; the Y axis shows the intensity of the fragments, based on their relative abundance. (B) Mean residue molar ellipticity at 222 nm of recombinant peptide AgCecropB in the presence of SDS. In the X axis the SDS molar concentration is expressed and in the Y axis is plotted the AgCecropB mean residue molar ellipticity value at 222 nm. Inset: circular dichroism spectrum (220-260 nm). X axis shows the wavelength and in the Y axis the mean residue molar ellipticity. Black line: control without SDS; red line: AgCecropB in the presence of SDS 50 mM; green line: AgCecropB in the presence of SDS 100 mM. (C) Center of mass analysis plot at 280 nm. In the X axis the SDS molar concentration is expressed and in the Y axis is plotted the uptake wavelength of AgCecropB center of mass. Inset: tryptophan intrinsic fluorescence assay plot measured at 280 nm; in the X axis is showed the absorption wavelength and in the Y axis the fluorescence intensity. Black line: control without SDS; red line: AgCecropB in the presence of SDS 50 mM; green line: AgCecropB in the presence of SDS 100 mM.

