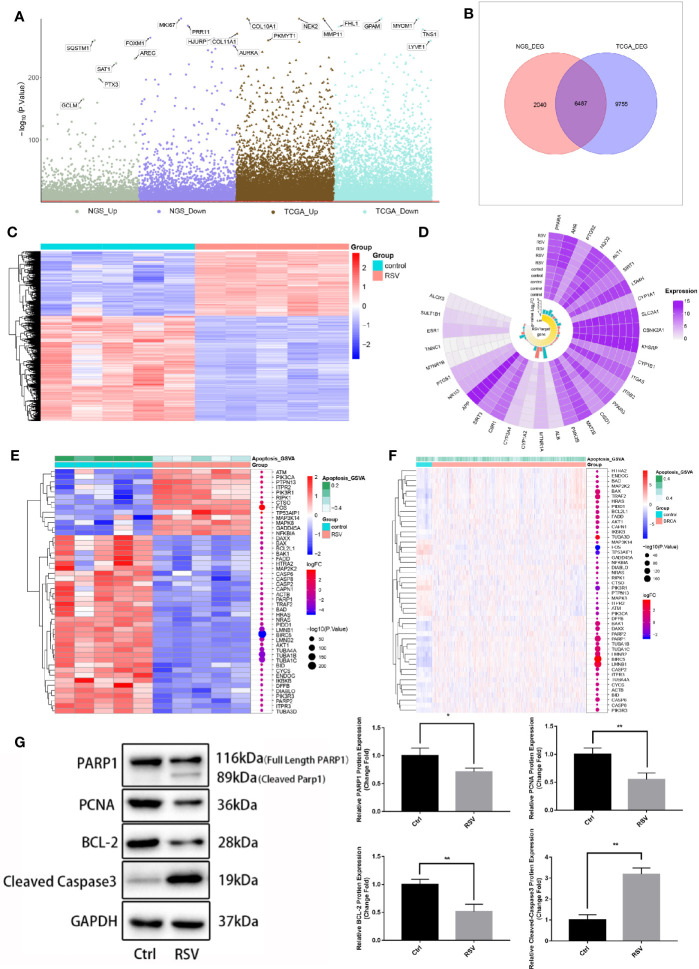
Figure 3.
Genes affecting resveratrol in the treatment of MDA-MB-231 cells. (A) Manhattan map. The differential expression analysis of the sequencing data of 50 μM resveratrol-treated MDA-MB-231 cell samples -control samples and the differential expression analysis of breast cancer samples - control samples of the TCGA database are respectively displayed. (B) Venn diagram. The intersection in the figure is the gene with the opposite differential expression, which is defined as the gene affected by resveratrol in the treatment of breast cancer. (C) Expression heat map of genes affected by resveratrol in breast cancer treatment. (D) Circplot of resveratrol target in drugbank and resveratrol target domain protein in protein data bank (RNA sequencing data). (E) Apoptotic pathway-differential gene expression heat map (RNA sequencing data). (F) Apoptotic pathway-differential gene expression heat map (TCGA download breast cancer data). (G) Expression of apoptosis-related proteins in MDA-MB-231 cells after optimal resveratrol treatment (PARP1: *P=0.03, PCNA: **P=0.008, BCL-2: **P=0.006, Cleaved Caspased 3: **P=0.001).

