
Figure 2.
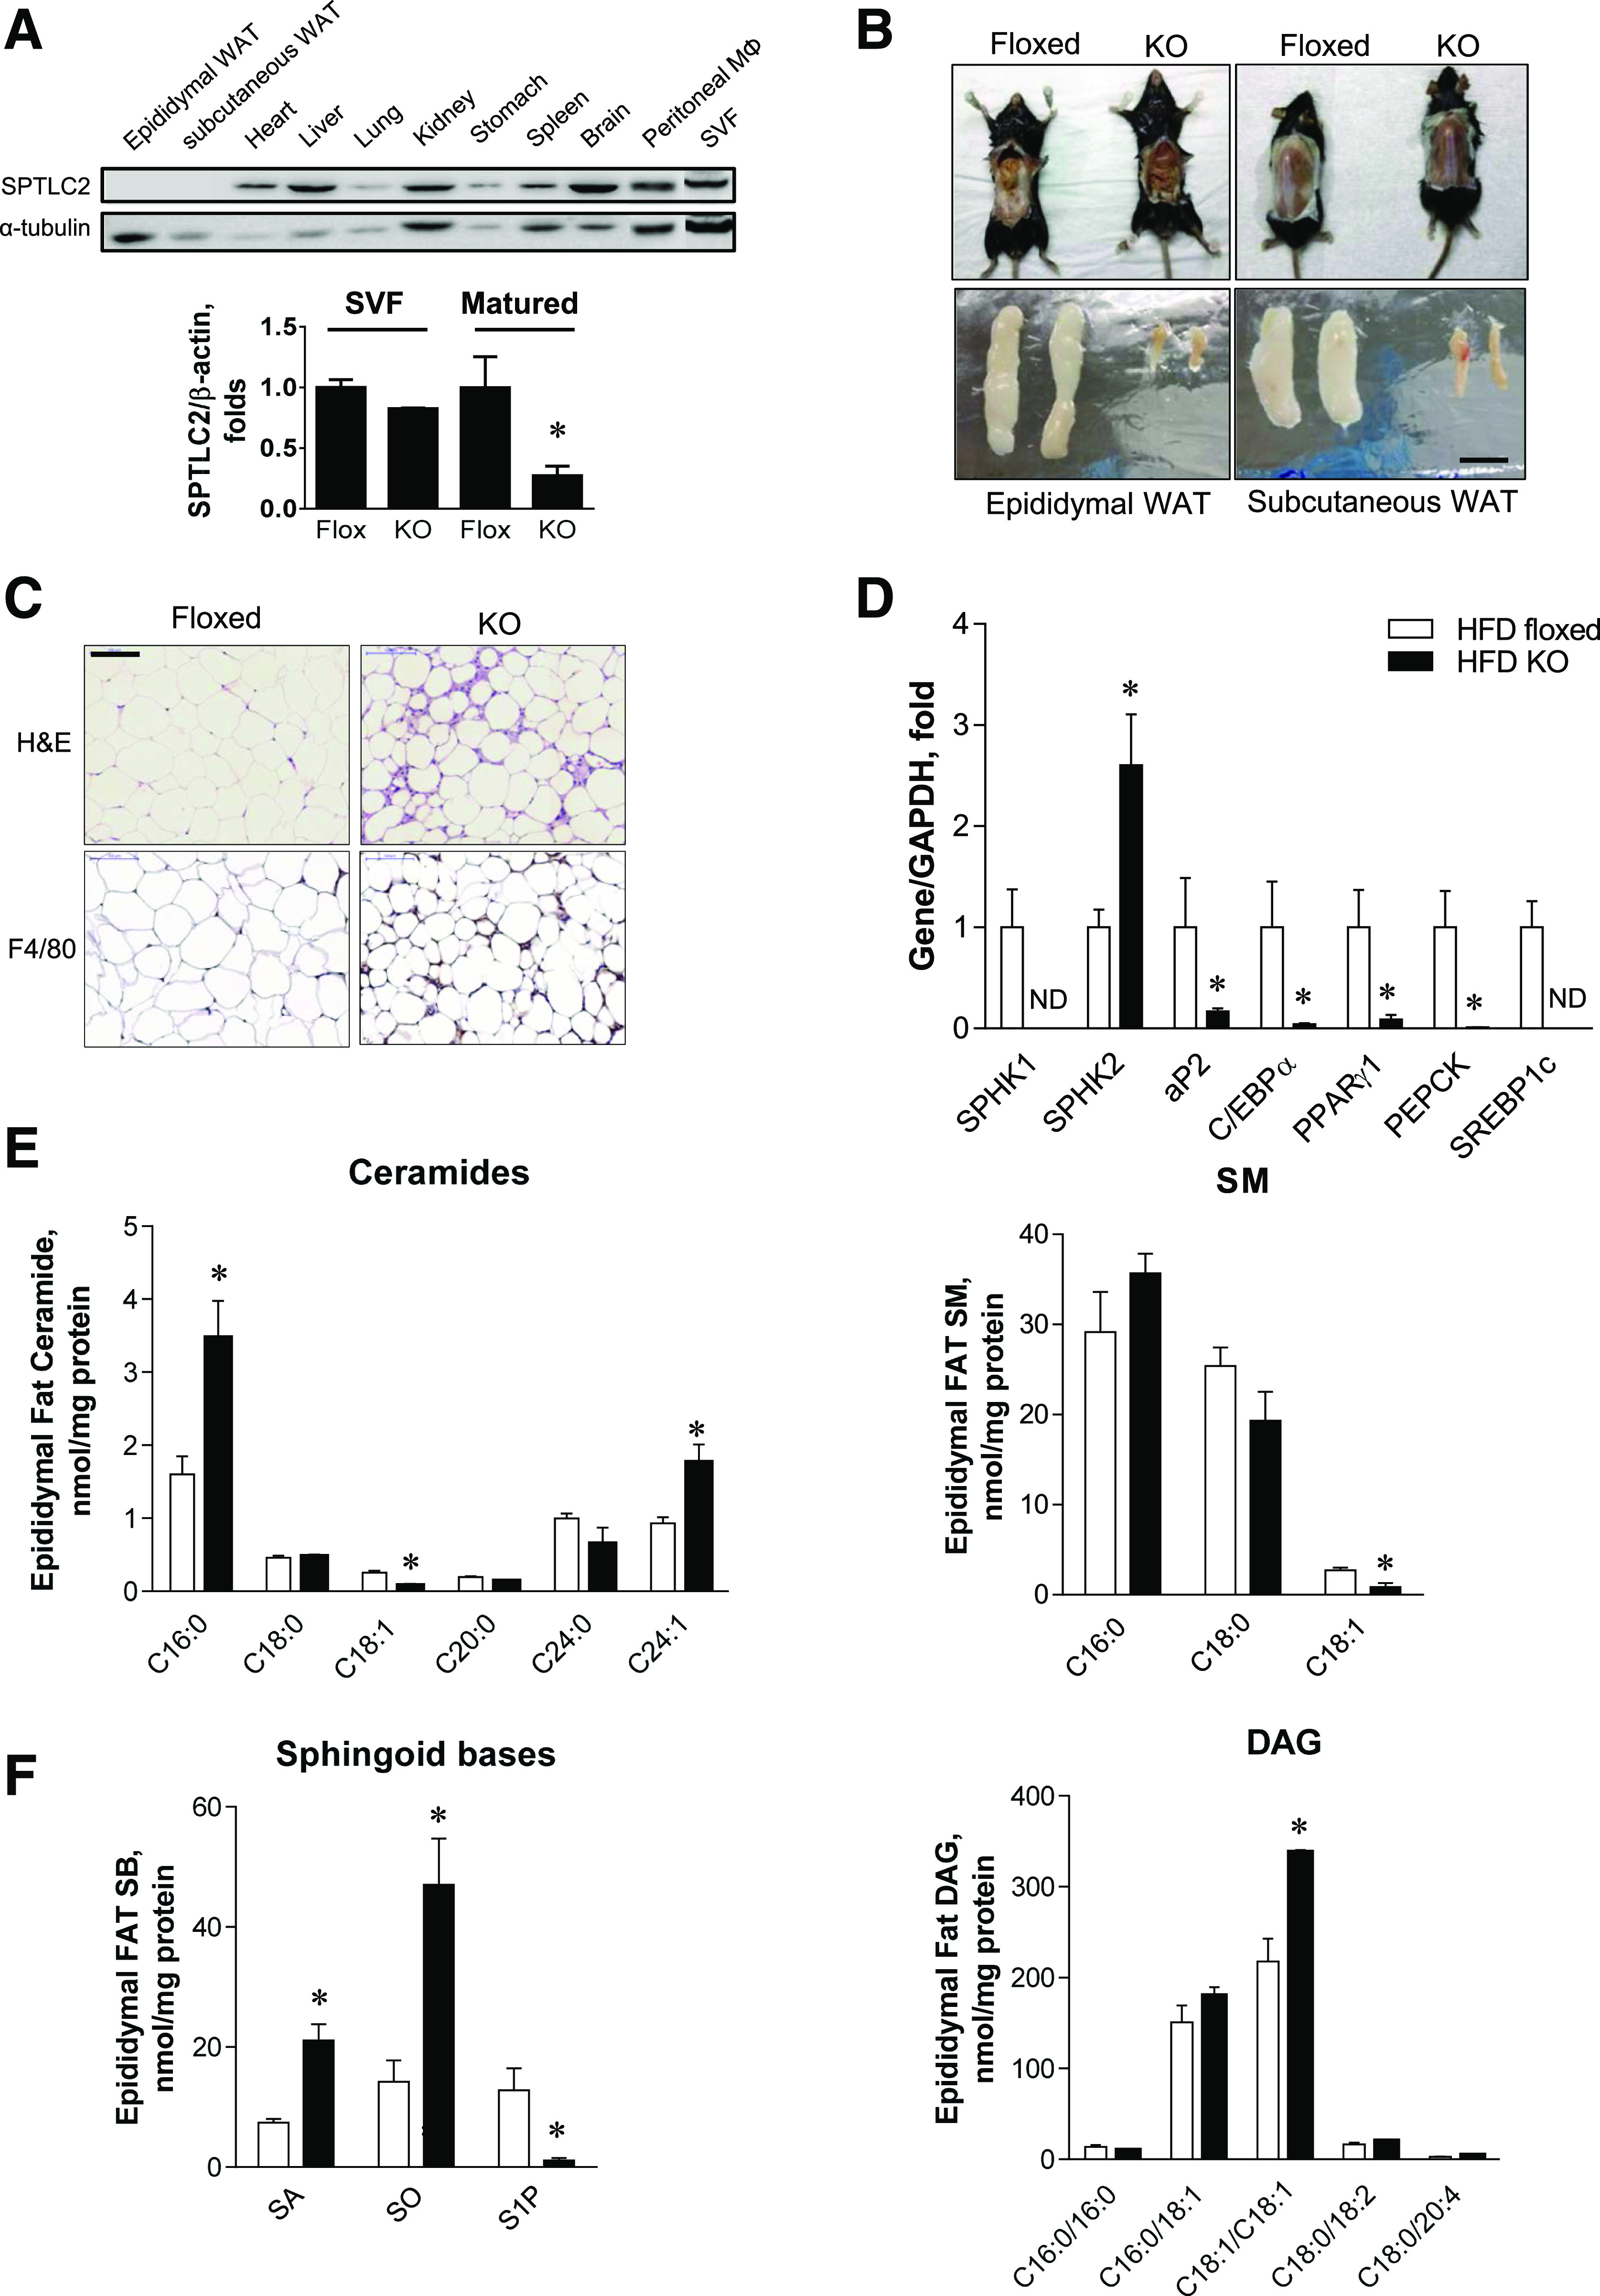
aSPTLC2 KO mice develop lipodystrophy. A: Expression of SPTLC2 protein in various tissues isolated from aSPTLC2 KO mice and expression of SPTLC2 mRNA in SVF and mature adipocytes from aSPTLC2 KO mice. B: Adipose tissue reduction in aSPTLC2 KO mice fed an HFD (45% kcal fat for 8 weeks). The scale bar indicates 1 cm. C: H-E and F4/80 staining of epididymal WAT sections. The scale bar indicates 100 μm. D: Quantitative real-time PCR analyses of adipogenic genes. Mean ± SEM. *P < 0.05 vs. floxed mice. n = 5–6. ND, not determined. E: Analyses of ceramides and sphingomyelin (SM) in epididymal adipose tissues by LC-MS/MS. F: Analyses of sphingoid bases (SB) and DAG by LC-MS/MS. Mean ± SEM. *P < 0.05 vs. floxed mice. n = 5–6.