
Figure 4.
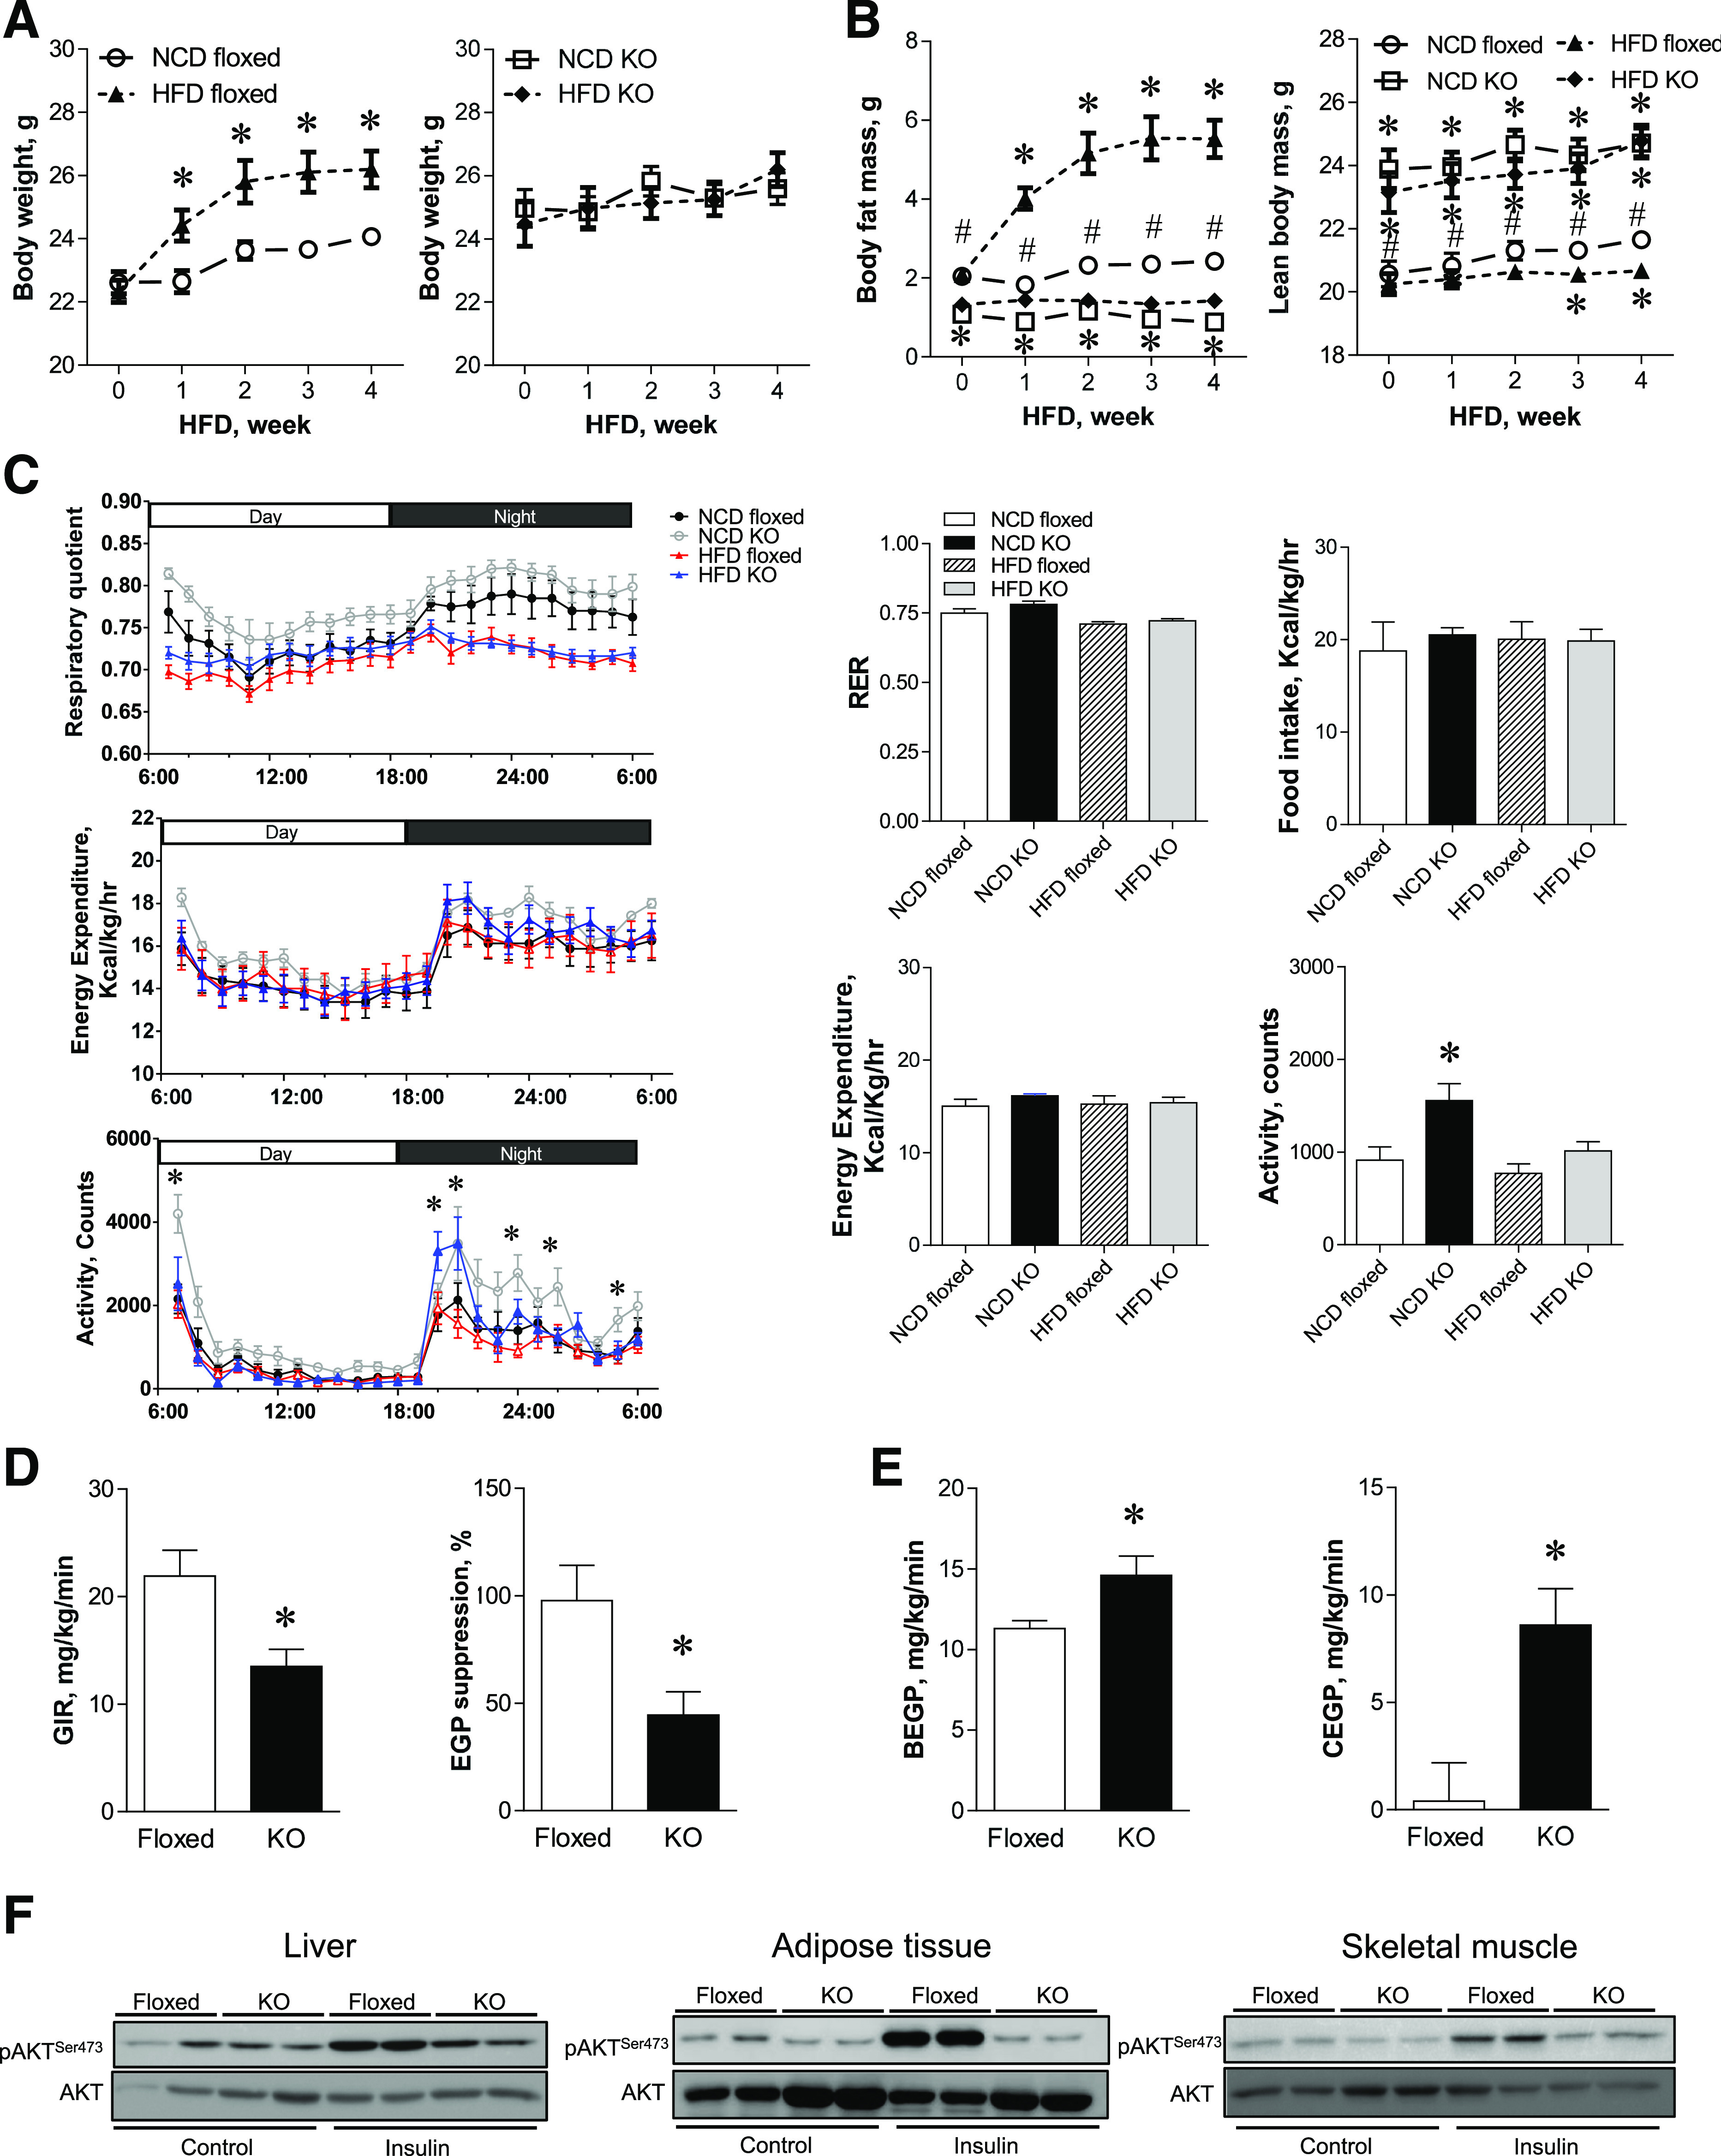
aSPTLC2 KO mice are resistant to HFD-induced obesity but develop insulin resistance. A: Body weight change of the floxed and aSPTLC2 KO mice fed an NCD and an HFD (60% kcal fat) over 4 weeks. *P < 0.05 vs. floxed mice fed an NCD. B: Measurement of body composition of the floxed and aSPTLC2 KO mice fed an NCD or HFD by 1H NMR. Mean ± SEM. *P < 0.05 vs. floxed mice fed an NCD; #P < 0.05 vs. aSPTLC2 KO mice fed an NCD. n = 10–14. C: Metabolic changes in the floxed and aSPTLC2 KO mice. Basal energy balance including respiratory quotient (RER), energy expenditure, food intake, and activity was recorded after 4 weeks of NCD and HFD (60% kcal fat) using a Comprehensive Lab Animal Monitoring System. Data are presented as the mean ± SEM. *P < 0.05 vs. floxed mice fed an NCD. n = 10–14. D: Measurement of the glucose infusion rate (GIR) and hepatic glucose production (EGP) suppression by hyperinsulinemic-euglycemic clamp. *P < 0.05 vs. floxed mice fed an HFD. E: Measurement of the basal hepatic glucose production (BEGP) and hepatic glucose production during clamp (CEGP). *P < 0.05 vs. floxed mice fed an HFD. n = 10–14. F: AKT phosphorylation (p) of liver, adipose tissues, and skeletal muscle was assessed by immunoblotting 10 min after intraperitoneal insulin injection (0.5 units/kg body wt). hr, hour.