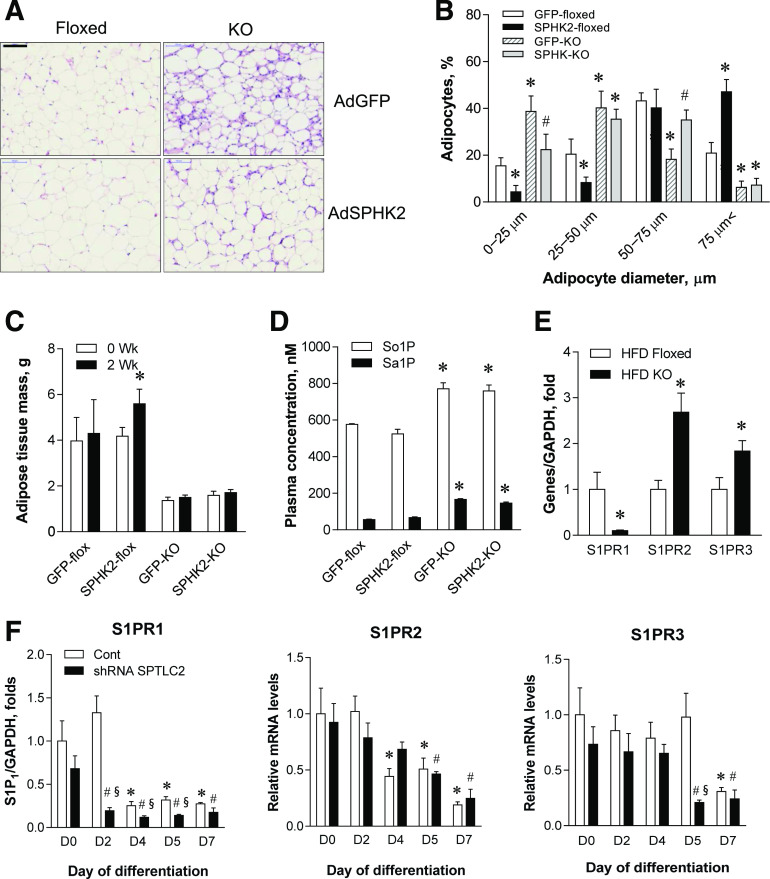
Figure 5.
Elevated S1P in circulation caused adipocyte hypertrophy. A: H-E staining of the adipose tissue sections from the floxed and aSPTLC2 KO mice. Mice were fed an HFD (60% kcal at) for 2 weeks, and adenovirus containing GFP (AdGFP) or SPHK2 (AdSPHK2) (1 × 10⁹ PFU) was injected in the tail vein. After 2 weeks postinjection, the adipose tissues were isolated. The scale bar indicates 100 μm. B: Quantitation of adipocyte size in the floxed and aSPTLC2 KO mice injected with AdGFP or SPHK2. Data represents mean ± SEM. *P < 0.05 vs. floxed mice injected with adenovirus containing GFP; #P < 0.05 vs. aSPTLC2 KO mice injected with AdGFP. n = 5. C: Measurement of body fat composition (1H NMR). Mean ± SEM. *P < 0.05 vs. before adenoviral injection (0 week). n = 5. D: Plasma concentration of sphingosine 1-phosphate (So1P) and sphinganine 1-phosphate (Sa1P). Mean ± SEM. *P < 0.05 vs. floxed mice injected with AdGFP. n = 5. E: Quantitative RT-PCR analyses of S1PRs in the adipose tissues isolated from the floxed and aSPTLC2 mice fed an HFD (60% kcal fat) for 4 weeks. Mean ± SEM. *P < 0.05 vs. floxed mice fed an HFD. n = 5. F: Quantitative real-time PCR analyses of S1PRs in the control (Cont) and SPTLC2 shRNA–suppressed 3T3-L1 adipocytes during differentiation. Mean ± SEM. *P < 0.05 vs. D0 of the control; #P < 0.05 vs. the control of each day; §P < 0.05 vs. D0 of the shRNA SPTLC2. n = 3. Wk, weeks.

