
Figure 6.
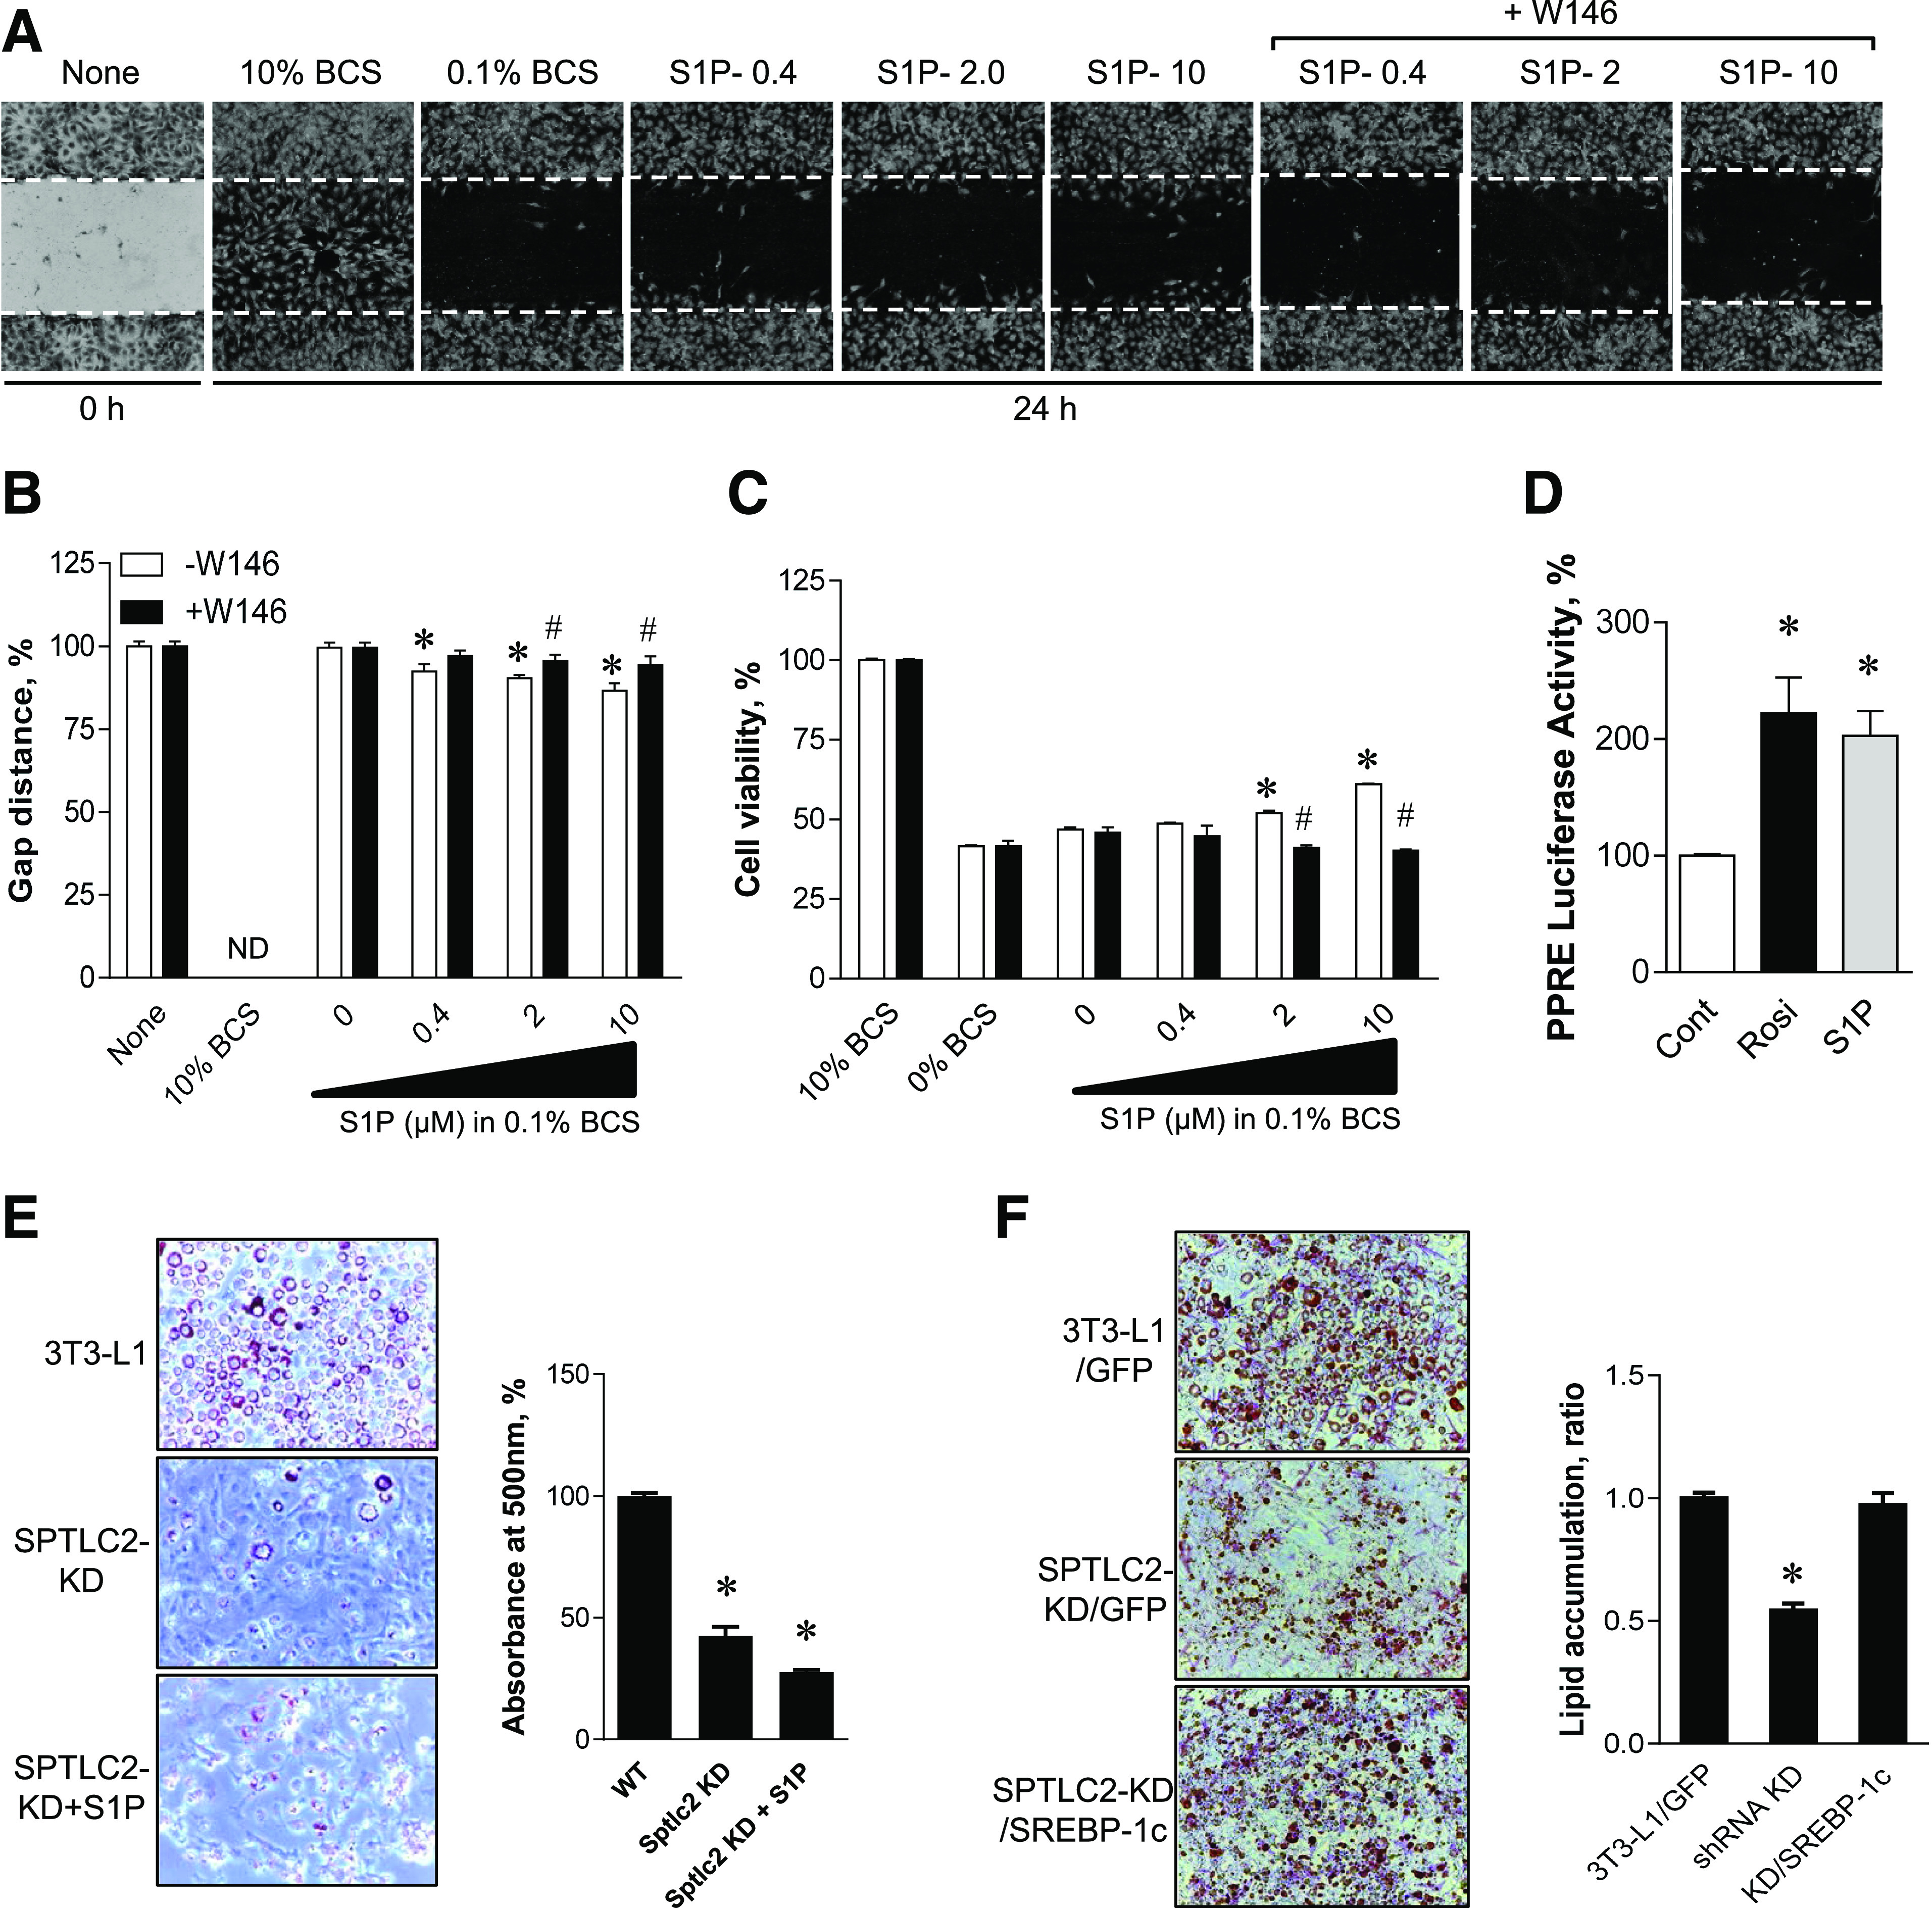
Activation of PPARγ and proliferation of 3T3-L1 preadipocytes by S1P and restoration of adipogenesis by SREBP-1c expression. A: 3T3-L1 preadipocytes were treated with various S1P concentrations in the presence or absence of 10 μmol/L W146 for 24 h, and migration into the scraped area was observed. B: Cell migration was determined in the presence or absence of 10 μmol/L W146 by the wound-healing assay and quantified as a ratio of the gap distance at 24 h relative to that at 0 h. Mean ± SEM. *P < 0.05 vs. the control group; #P < 0.05 vs. –W146 group at same S1P concentrations. n = 6. ND, not determined. C: 3T3-L1 cell viability was assessed by XTT (2,3-Bis-[2-Methoxy-4-Nitro-5-Sulfophenyl]-2H-Tetrazolium-5-Carboxanilide) assay after treatment with increasing concentrations of S1P for 24 h. Mean ± SEM. *P < 0.05 vs. the control group; #P < 0.05 vs. –W146 group at same S1P concentrations. n = 6. D: AML-12 cells were transiently transfected with vectors containing PPRE-x3-TK-Luc constructs. After 24 h incubation, cells were treated with 5 μmol/L S1P or 10 μmol/L rosiglitazone (Rosi) for 6 h. Cell lysates were prepared for the luciferase assay, and luciferase activity was measured using a luminometer. Mean ± SEM. *P < 0.05 vs. the control. n = 5. E: WT and shRNA SPTLC2-KD cells were treated with 10 μmol/L S1P during differentiation by insulin cocktail. Formation of droplets was quantified by Oil Red O and absorbance measurement at 500 nm. This pictures were magnified by ×20. Mean ± SEM. *P < 0.05 vs. the control. n = 3. WT, wild type. F: SPTLC2 shRNA 3T3-L1 stable preadipocytes were infected with lentivirus containing GFP or SREBP-1c. Then differentiation was initiated by insulin cocktail. The degree of lipid droplet formation was quantified by Oil Red O staining and absorbance measurement. Mean ± SEM. *P < 0.05 vs. the control. n = 3. BCS, bovine calf serum.