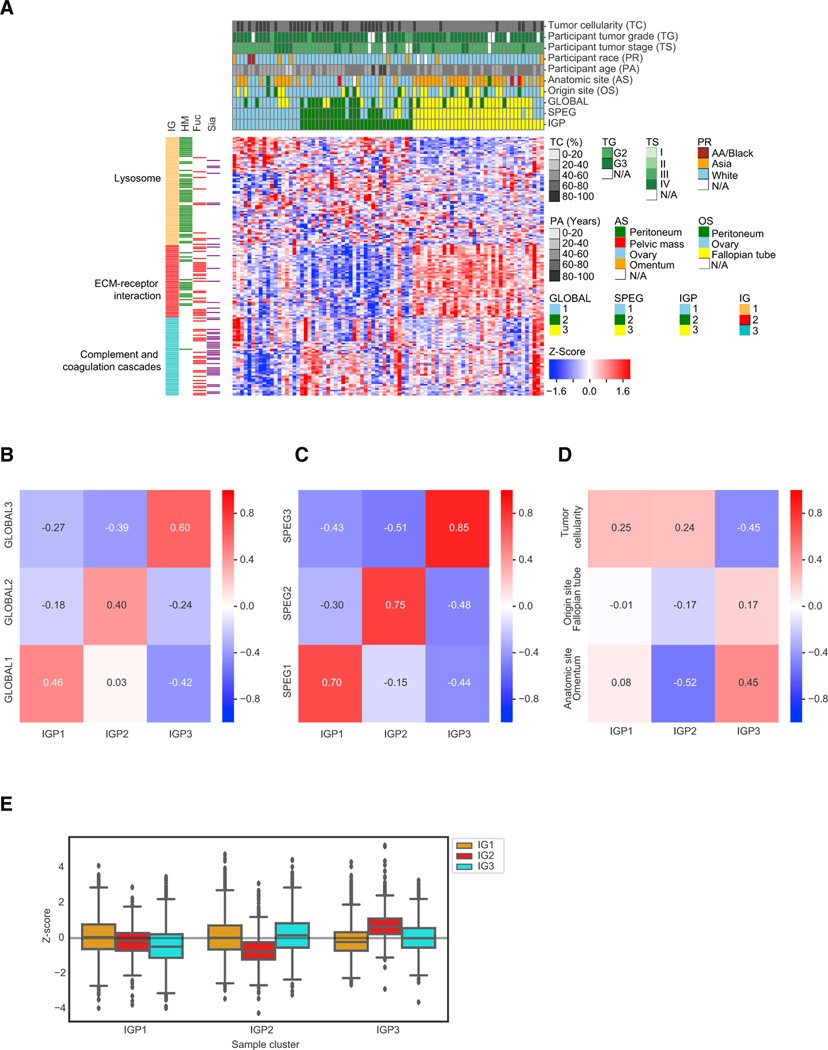
Figure 2. The Proteomic and Glycoproteomic Investigation in Tumor Clusters.
(A) Hierarchical clustering of tumor samples based on their Z score transformed abundance of IGPs from the IGP dataset. The clinical phenotypes of all 83 tumor samples, including tumor cellularity, tumor grade, tumor stage, participant race, participant age, anatomic site, origin site, and the labeled tumor clusters classified from GLOBAL, SPEG, and IGP datasets, were shown in the top rows of the clustered heatmap. The left columns showed the overrepresented pathways in the three IGP groups (IGs) and the associated glycan types on the IGPs. HM, high-mannose glycans; Fuc, fucosylated glycans; Sia, sialylated glycans.
(B) The pairwise correlation values between the three tumor clusters based on GLOBAL and IGP datasets, respectively.
(C) The pairwise correlation values between the three tumor clusters based on SPEG and IGP datasets, respectively.
(D) The pairwise correlation values between the three clinical phenotypes (tumor cellularity, anatomic site, and origin site) and the three tumor clusters in the IGP dataset.
(E) The abundance comparison of three IGP groups (IGs) grouped by three tumor clusters in the IGP dataset.
Fuc, fucose; HM, high mannose; Sia, Sialic acid. See also Table S5 and Figure S2.

