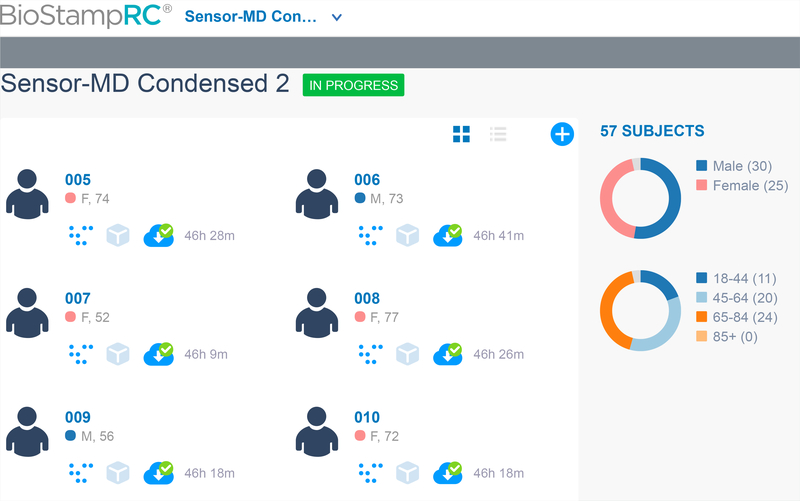
Fig. 5.
Screen shot of MC10 web portal used in our PD/HD case study (named Sensor-MD Condensed 2). We can identify six subjects with unique subject ID (005), sex (M/F), and age (years) indicated on the right side. Total duration of recorded data is indicated on the right of an icon with a green tick mark. Clicking on the green tick marked icon downloads the data which can be utilized for analysis. On the far right, we can observe the statistics of the study showing the total number of subjects in the study followed by graphs showing number of male and female participants and age distribution.

