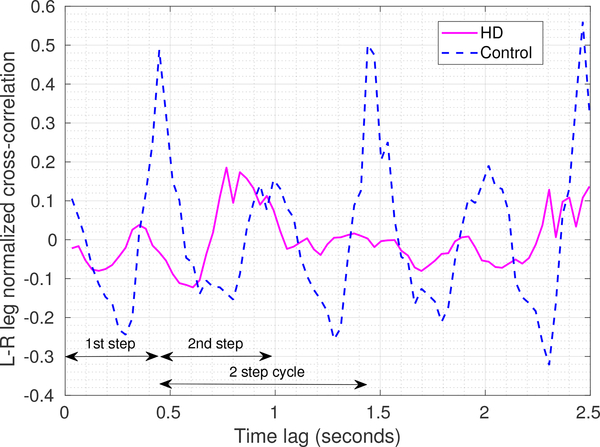
Fig. 7.
Data analysis performed for our PD/HD case study to assess inter-leg coordination. The plot shows the normalized vector cross-correlation [124] of the recorded accelerations from left leg and right leg sensors as a function of time lags for a HD and a control participant. A 2-step cycle is annotated and highlights stronger peaks for the controls at the one and two step intervals compared with participants with HD.

