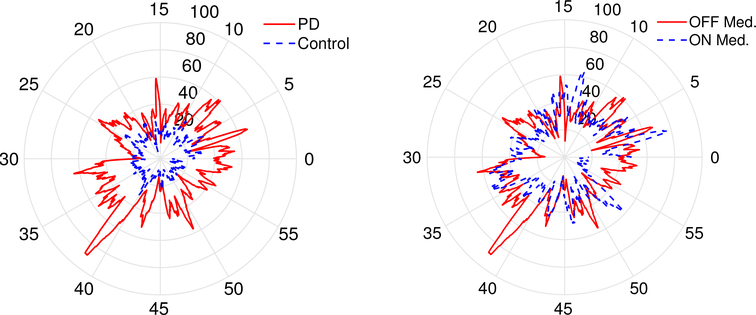
Fig. 8.
Visualization example from our PD/HD case study. A clock based visualization shows the variation in at-rest tremor magnitude in individuals with PD and compares it against controls and between on and off medication states. The tremor magnitude is quantified as the fraction of power in the 4 to 6.5 Hz frequency band (radial axis) for the principal axis acceleration recorded from MC 10 sensors affixed to the forearm over an hour duration (angular axis): (a) PD vs control (left), and b) PD ON vs OFF medication (right).

