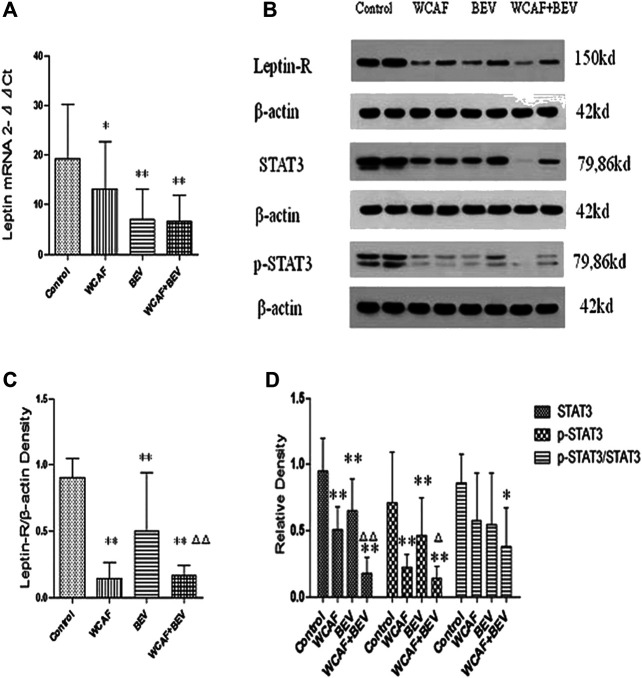
FIGURE 6.
Effect of WCAF on Leptin, Leptin-R, STAT3, and p-STAT3 expression. (A) RT-PCR analysis of Leptin mRNA expression. Data are presented as mean. *p < 0.05, △ p < 0.01 compared with the control group. (B) Western blot analysis of the protein expression of LeptinR-1, STAT3, and p-STAT3. (C) Quantification of band intensities of Leptin-R. ** p < 0.01 vs. control group. △△ p < 0.01 vs. BEV group. (D) Quantification of band intensities of STAT3, p-STAT3, and p-STAT3/STAT3. *p < 0.05 vs. control group, ** p < 0.01vs. control group. △ P< 0.05 vs BEV group.△△ p < 0.01 vs. BEV group.

