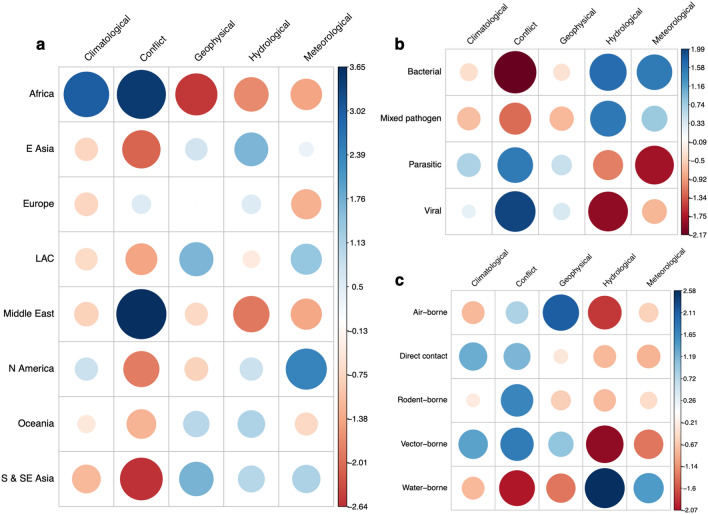
Figure 4.
Correlation plots for the Pearson’s chi squared test residuals for each catagories in a, region against disaster (X-squared = 101.81, df = 28, P-value ≤ 0.05), b, disease against disaster (X-squared = 31.49, df = 12, P-value ≤ 0.05) and c, disease transmission against disaster (X-squared = 47.31, df = 16, P-value ≤ 0.05). Positive residuals are blue, suggesting a positive association between the corresponding row and column and negative residuals are red, suggesting a negative association.

