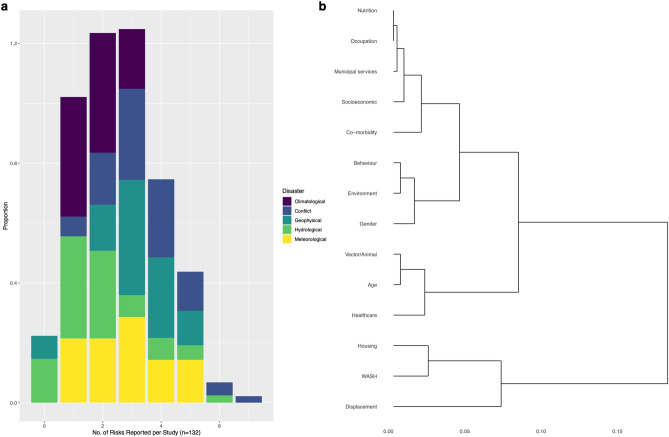
Figure 7.
Multi-risk reporting and hierarchical clustering. (a), Proportions of studies (n = 132) which reported either 0 to 7 different risk factors, within the fourteen main clusters. (b), cluster dendrogram from hierarchical cluster analysis for the fourteen main risk factor clusters. Individual segments (leaves) on the lower part of the tree are more related to each other, as indicated by distances between the branches. The scale bar showing the dissimilarity distance between the proportions of each risk cluster.

