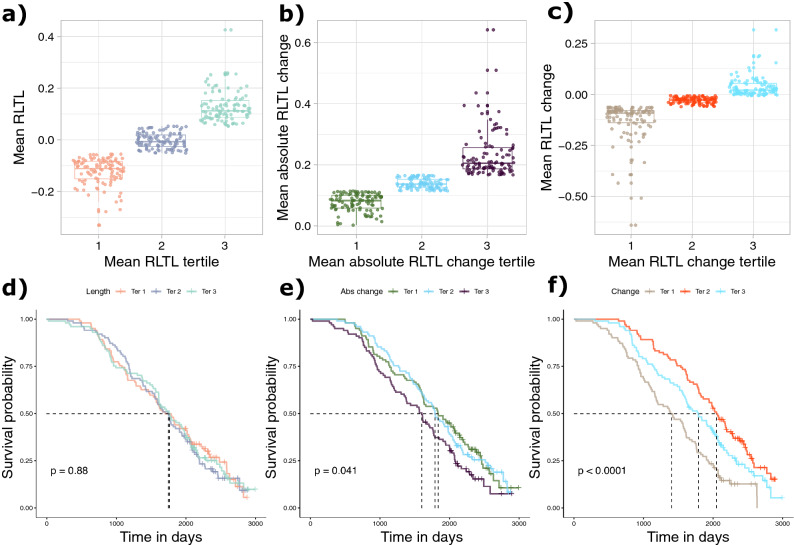
Figure 3.
Relationship between lifetime telomere length dynamics and productive lifespan. RLTL measurements were grouped into tertiles as shown for (a) mean RLTL, (b) mean absolute RLTL change and (c) mean RLTL change. Kaplan–Meier curves show relationship of lifetime RLTL dynamics tertiles with productive lifespan. (d) Greater lifetime mean RLTL (tertile 3) was not significantly differently associated with productive lifespan than moderate or short lifetime mean RLTL (tertiles 2 and 1). (e) Greater mean absolute RLTL change (tertile 3) measured over the lifetime was associated with shorter productive lifespan compared to animals with moderate (tertile 2) or little (tertile 1) mean absolute RLTL change. (f) Greater mean lifetime RLTL attrition was associated with shorter productive lifespan. It can be seen that the mean survival of the group with the most RLTL attrition was about 600 days shorter than the mean survival of the group showing the most stable RLTL with neither dramatic shortening nor elongation (tertile 2).

