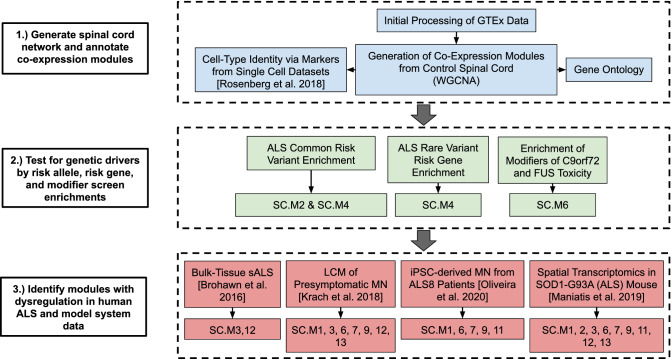
Figure 1.
Overview of spinal cord co-expression network analysis. Flow diagram of analyses in this study. A co-expression network was generated using the GTEx cervical spinal cord expression data and Weighted Gene Co-Expression Network Analysis (WGCNA). Modules were annotated by their associated biological processes, hub genes, and cell-type identities. Modules were then assessed for their enrichment of ALS genetic risk factors and analyzed for differential expression in RNA-seq data from human ALS tissues and model system studies12,13,22,23.

