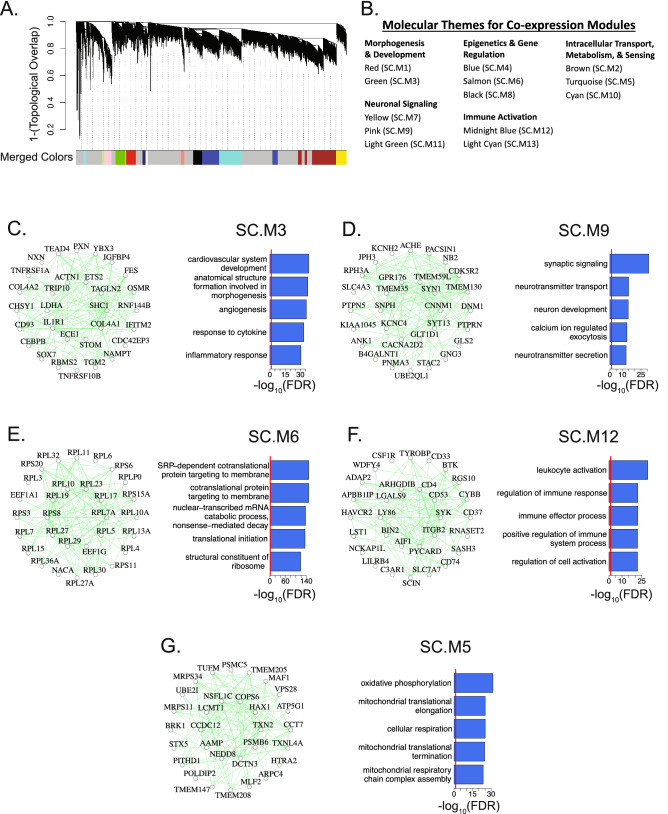
Figure 2.
Construction of co-expression network in control cervical spinal cord. (A) Dendrogram of the topological overlap matrix for gene co-expression dissimilarity. Co-expression module assignments are shown in the “Merged Colors” track (See Supplementary Fig. S2 for optimization of tree-cutting parameters). Genes that failed to be clustered into a co-expression module were grouped within the grey module. (B) Thirteen co-expression modules were categorized into five broad molecular themes based on Gene Ontology (GO) term enrichment and assigned a unique module identifier (SC.M1-13). (C–G) Top 30 hub genes and 300 connections for SC.M3, SC.M9, SC.M6, SC.M12, and SC.M5 respectively (left panels). Top 5 enriched GO terms for each of the respective modules (right panels). Red lines mark an FDR corrected p-value threshold of 0.05.

