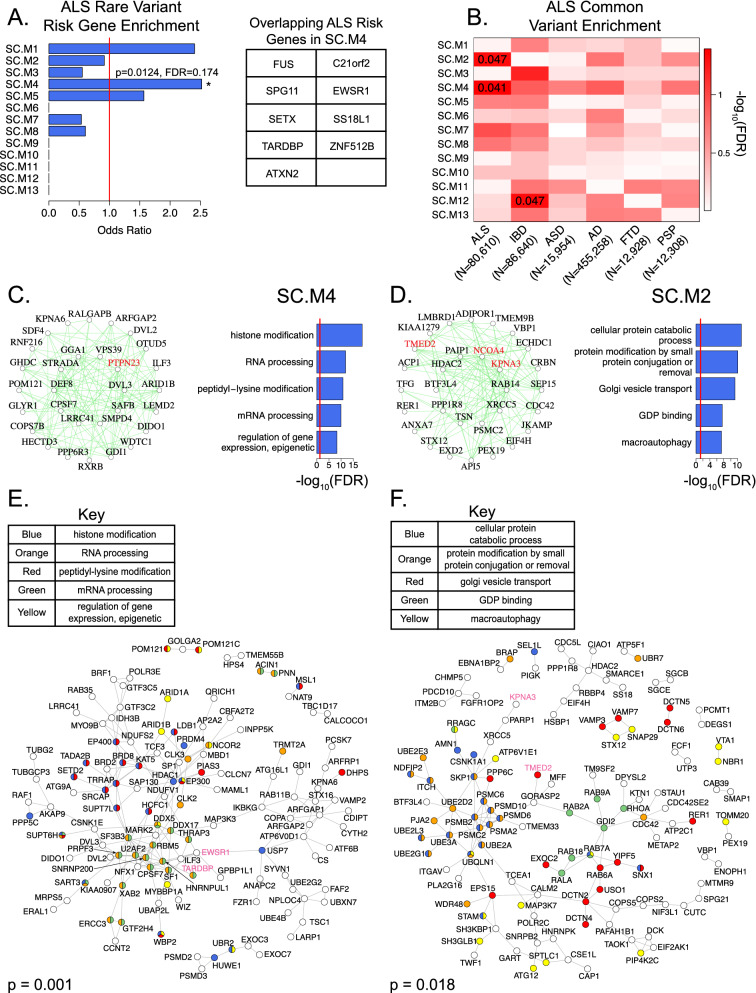
Figure 3.
Enrichment of ALS genetic risk factors in intracellular transport/autophagy module SC.M2 and RNA processing/gene regulation module SC.M4. (A) Enrichment of literature curated large-effect ALS risk genes19,20 within co-expression modules (left panel). Red line marks a baseline odds ratio of 1. SC.M4 is marked with an asterisk as having a nominal enrichment p-value < 0.05. Literature-curated large-effect ALS risk genes within the SC.M4 module (right panel). (B) Partitioned heritability enrichments of common risk variants for ALS21, IBD30, ASD32, 33, AD34, FTD35, and PSP36 within co-expression modules. Text values of enrichments with FDR corrected p-value < 0.05 are shown. (C,D) Top 30 hub genes and 300 connections for SC.M4 and SC.M2 respectively (left panels). Highlighted in red are genes that have been previously implicated in ALS pathophysiology27,43–45. Top 5 enriched GO terms for each of the respective modules (right panels). Red lines mark an FDR corrected p-value threshold of 0.05. (E,F) Direct protein–protein interaction (PPI) network of the top 300 hub genes from modules SC.M4 and SC.M2 respectively. Gene vertices are color coded according to their Gene Ontology terms as shown63. P-value of the PPI network is derived from 1000 permutations. Highlighted in pink are genes that have been previously implicated in ALS pathophysiology27,43–45.

