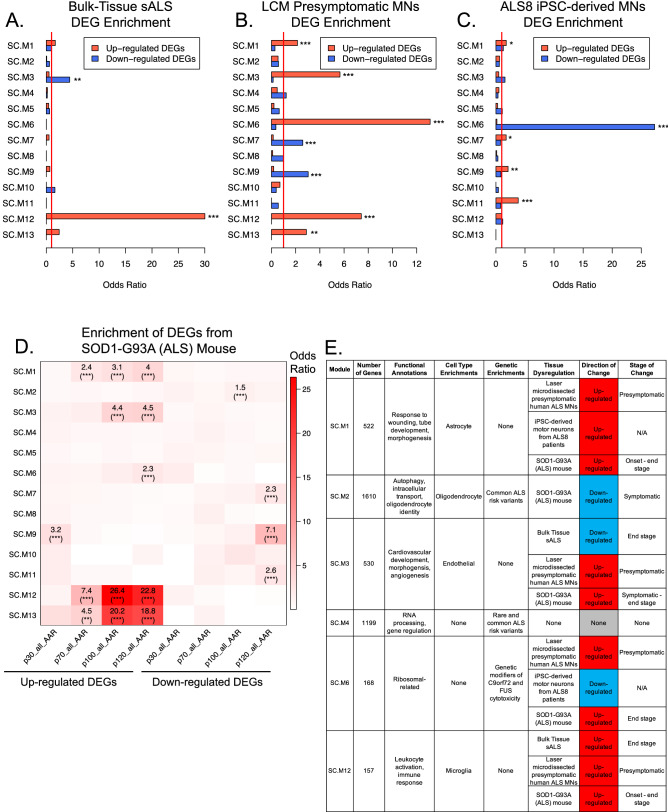
Figure 5.
Validation of co-expression module dynamics in human ALS and model system datasets. (A) Enrichments of 112 up-regulated and 70 down-regulated DEGs from bulk-tissue RNA-sequencing of postmortem ALS cervical spinal cord13 within co-expression modules. Red line marks a baseline odds ratio of 1. * (FDR corrected p-value < 0.05). ** (FDR corrected p-value < 0.01). *** (FDR corrected p-value < 0.001). (B) Same as (A) except for using 1290 up-regulated and 310 down-regulated DEGs from RNA-sequencing of laser capture microdissections of motor neurons primed for degeneration22. (C) Same as (A) except for using 364 up-regulated and 289 down-regulated DEGs from RNA-sequencing of iPSC-derived motor neurons from ALS8 patients23. (D) Enrichment of DEGs within each disease stage of the SOD1-G93A mouse12 within co-expression modules. p30, p70, p100, and p120 represent postnatal age in days at time of spatial transcriptomic sequencing. Odds ratios of enrichments with FDR corrected p-value < 0.05 are shown. * (FDR corrected p-value < 0.05). ** (FDR corrected p-value < 0.01). *** (FDR corrected p-value < 0.001). (E) Summary of the key findings from this study regarding modules relevant to ALS pathophysiology.

