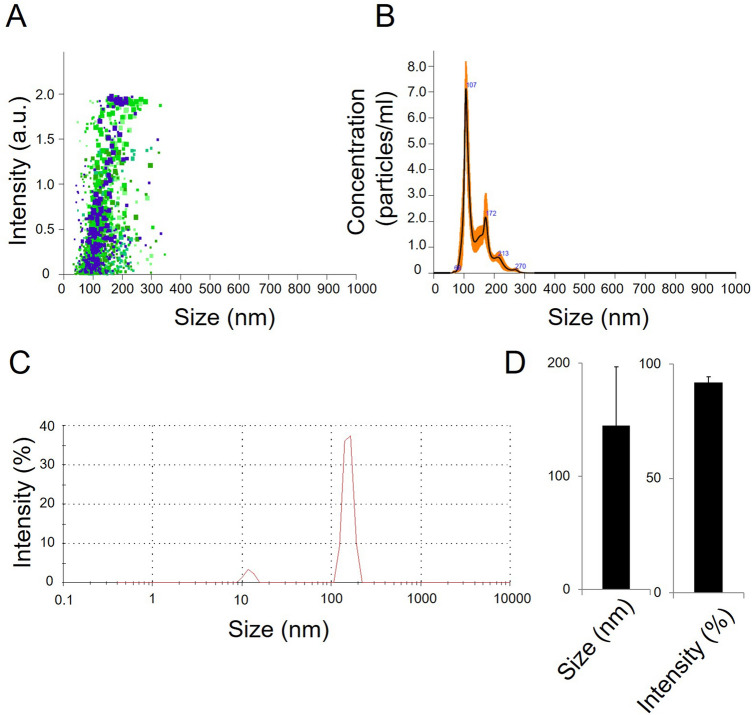
Figure 3.
Quantification of particle number, size, and intensity in lyophilized SARS-CoV-2. (A) Plot showing intensity versus the size of the particles in SK-01 V1 (inactivated virus & GM-CSF). (B) Plot showing means of particle size of SK-01 V1 in the sample read three times concerning the concentration. (C) Graph illustrating zeta analysis of inactivated virus particles in OZG-3861 V1 concerning intensity. (D) Bar graphs showing quantified size and intensity of the sample.

