Figure 4.
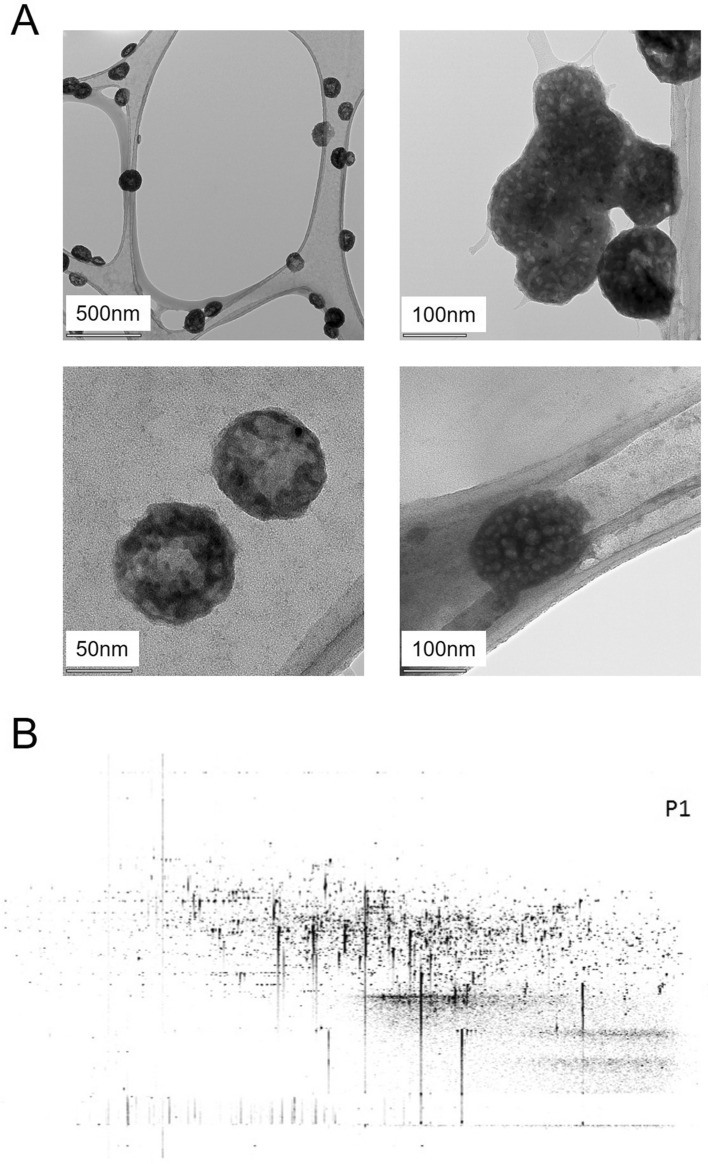
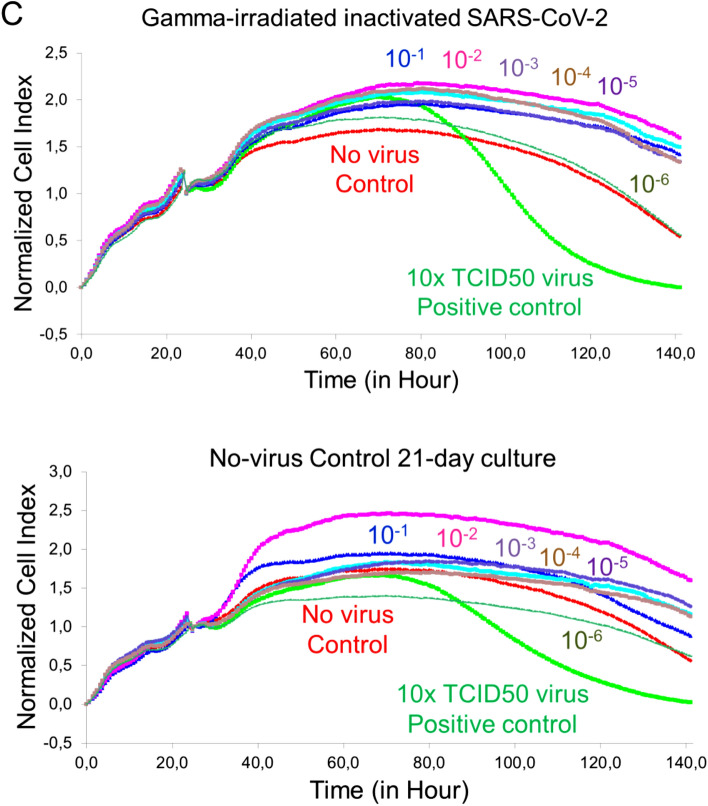
Transmission electron microscopy imaging and proteome analysis. (A) Representative electron micrographs of inactivated SARS-CoV-2. The group of virus particles was seen on the grid (Scale bars: 500 nm, 100 nm, 50 nm). (B) Proteome analysis of inactivated SARS-CoV-2 product. (C) Graphs showing real-time cell analysis of gamma-irradiated inactivated SARS-CoV-2 and no—virus control cultured on Vero for 21 days to determine the presence/absence of cytopathic effect in a dose-dependent manner. The Red line is no virus Vero internal control and the Green line is 10 × TCID50 doses of infective SARS-CoV-2 as a positive control.


